Verification of NDFD Gridded Forecasts Using ADAS: Insights and Methodologies
This study investigates the verification of NDFD (National Digital Forecast Database) gridded forecasts of temperature, dew point temperature, and wind speed across the western United States. Employing the Advanced Regional Prediction System Data Assimilation System (ADAS), we compare NDFD forecasts against analyses developed at the Cooperative Institute for Regional Prediction at the University of Utah. The research spans from November 12 to December 28, 2003, focusing on improving verification techniques essential for understanding the performance of the Interactive Forecast Preparation System (IFPS).

Verification of NDFD Gridded Forecasts Using ADAS: Insights and Methodologies
E N D
Presentation Transcript
VERIFICATION OF NDFD GRIDDED FORECASTS USING ADASJohn Horel1, David Myrick1, Bradley Colman2, Mark Jackson31NOAA Cooperative Institute for Regional Prediction2National Weather Service, Seattle3National Weather Service, Salt Lake City Objective: Verify month sample of NDFD gridded forecasts of temperature, dew point temperature, and wind speed over the western United States
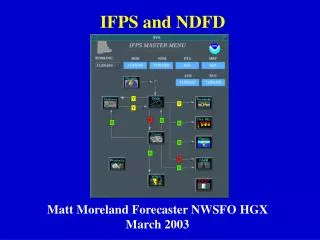
IFPS and NDFD • NWS has undergone major change in procedures to generate and distribute forecasts • Interactive Forecast Preparation System (IFPS; Ruth 2002) used to create experimental high-resolution gridded forecasts of many weather elements • Forecast grids at resolutions of 1.25, 2.5, or 5 km produced at each NWS Warning and Forecast Office (WFO) and cover their respective County Warning Area (CWA) • CWA grids combined into National Digital Forecast Database (NDFD; Glahn and Ruth 2003) at 5-km resolution • NDFD elements include: temperature, dewpoint, wind speed, sky cover, maximum and minimum temperature, probability of precipitation, and weather • Available up to hourly temporal intervals with lead times up to 7 days • Products can be: • viewed graphically • downloaded by customers and partners • linked to formatting software to produce traditional NWS text products
Validation of NDFD Forecast Grids Developing effective gridded verification scheme is critical to identifying the capabilities and deficiencies of the IFPS forecast process (SOO White Paper 2003) • National efforts led by MDL to verify NDFD forecasts underway • Objective: • Evaluate and improve techniques required to verify NDFD grids • Method • Compare NDFD forecasts to analyses created at the Cooperative Institute for Regional Prediction (CIRP) at the University of Utah, using the Advanced Regional Prediction System Data Assimilation System (ADAS) • Period examined 12 November – 28 December 2003. 00UTC NDFD forecasts only • Many complementary validation strategies: • Forecasts available from NDFD for a particular grid box are intended to be representative of the conditions throughout that area (a 5 x 5 km2 region) • Interpolate gridded forecasts to observing sites • Compare gridded forecasts to gridded analysis based upon observations • Verify gridded forecasts only where confidence in analysis is high
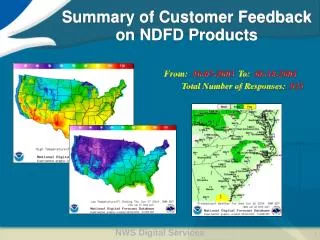
MesoWest: Cooperative sharing of current weather information around the nation Real-time and retrospective access to weather information through state-of-the-art database http://www.met.utah. edu/mesowest ROMAN:Real-Time Observation Monitor and Analysis Network Provide real-time weather data around the nation to meteorologists and land managers for fire weather applications MesoWest and ROMAN
2003 Fire Locations (Red); ROMAN stations (Grey) Fire locations provided by Remote Sensing Applications Center from MODIS imagery
Documentation • MesoWest: Horel et al. (2002) Bull. Amer. Meteor. Soc. February 2002 • ROMAN: • Horel et al. (2004) Submitted to International Journal of Wildland Fire. Jan. 2004 • Text: http://www.met.utah.edu/jhorel/homepages/jhorel/ROMAN_text.pdf • Figures: http://www.met.utah.edu/jhorel/homepages/jhorel/ROMAN_fig.pdf • Horel et al. (2004) IIPS Conference • ADAS: • Myrick and Horel (2004). Submitted to Wea. Forecasting.http://www.met.utah.edu/jhorel/cirp/WAF_Myrick.pdf • Lazarus et al. (2002) Wea. Forecasting. 971-1000. • On-line help: http://www.met.utah.edu/droman/help
Are All Observations Equally Bad? • All measurements have errors (random and systematic) • Errors arise from many factors: • Siting (obstacles, surface characteristics) • Exposure to environmental conditions (e.g., temperature sensor heating/cooling by radiation, conduction or reflection) • Sampling strategies • Maintenance standards • Metadata errors (incorrect location, elevation) SNZ
Are All Observations Equally Good? • Why was the sensor installed? • Observing needs and sampling strategies vary (air quality, fire weather, road weather) • Station siting results from pragmatic tradeoffs: power, communication, obstacles, access • Use common sense • Wind sensor in the base of a mountain pass will likely blow from only two directions • Errors depend upon conditions (e.g., temperature spikes common with calm winds) • Use available metadata • Topography • Land use, soil, and vegetation type • Photos • Monitor quality control information • Basic consistency checks • Comparison to other stations UT9
ADAS: ARPS Data Assimilation System • ADAS is run in near-real time to create analyses of temperature, relative humidity, and wind over the western U. S. (Lazarus et al. 2002 WAF) • Analyses on NWS GFE grid at 2.5, 5, and 10 km spacing in the West • Test runs made for lower 48 state NDFD grid at 5 km spacing • Typically > 2000 surface temperature and wind observations available via MesoWest for analysis (5500 for lower 48) • The 20km Rapid Update Cycle (RUC; Benjamin et al. 2002) is used for the background field • Background and terrain fields help to build spatial & temporal consistency in the surface fields • Efficiency of ADAS code improved significantly • Anisotropic weighting for terrain and coasts added (Myrick et al. 2004) • Current ADAS analyses are a compromise solution; suffer from many fundamental problems due to nature of optimum interpolation approach • Difficult to assess independently analysis quality: analysis can be constrained to match observations, which typically leads to spurious analysis in data sparse regions
Sensitivity to Obs. Errors ADAS Temp. Analysis 12UTC 18 March 2004
ADAS Limitations • Analysis depends strongly upon the background field • Hour-to-hour consistency only through background field • Analysis sensitive to choice of background error decorrelation length scale • Wind field not adjusted to local terrain • Anisotropic weighting only partially implemented • Manual effort required to maintain station blacklist
Anisotropic Weighting Reducing propagation laterally through terrain of observation corrections to background Myrick et al. (2004)
Key Points WRT Horizontal Resolution • High resolution analysis based upon coarse background field and sparse data is simply downscaling to specified grid terrain • High resolution analysis adds value if: • Quality data sources are available at high resolution • AND/OR a quality background field is available at high resolution • Spatial scales specified within analysis scheme determine degree to which observed local weather variations can be resolved by the analysis • Appropriate and practical constraints beyond mass balance are not clear for use in variational techniques
Weak winds reflect local blocking and other terrain effects that result in decoupling surface winds from synoptic forcing RUC SLP &MesoWestObservations12Z 10 Oct. 2003
Analyzed strong pre/post frontal winds consistent with synoptic-scale forcing Temperature and Wind RUC Analysis: 12 Z 10 Oct. 2003 Temperature (C) Vector Wind and Speed (m/s)
ADAS analysis colder than RUC in most locations Temperature and Wind ADAS Analysis: 12 Z 10 Oct. 2003 Temperature (C) Vector Wind and Speed (m/s) ADAS analysis, forced by local obs, weakens RUC winds: which is correct?
NDFD 12 H Temperature Forecast: VT 12Z 10 Oct. NDFD Temperature NDFD Wind
How “Good” are the Analysis Grids?Relative to MesoWest Observations in the West Temperature (oC): 12 Nov.- 28 Dec. 2003
How “Good” are the Analysis Grids?Relative to MesoWest Observations in the West Wind Speed (m/s): 12 Nov.- 28 Dec. 2003
Arctic Outbreak: 21-25 November 2003 NDFD 48 h forecast ADAS Analysis
Validation of NDFD Forecasts at “Points” • NDFD forecasts are intended to be representative of 5x5 km2 grid box • Compare NDFD forecasts at gridpoint adjacent (lower/left) to observations: inconsistent but avoids errors in complex terrain introduced by additional bilinear interpolation to observation location • Compare NDFD forecasts to ADAS and RUC verification grids at the same sample of gridpoints: no interpolation • All observation points have equal weight • Since they are distributed unequally, not all regions receive equal weight
Verification of NDFD relative to Obs or ADAS similar RUC: too warm at 12Z leads to large bias and RMS Verification at ~2500 Obs. Locations in the West
Smaller RMS relative to ADAS since evaluating NDFD at same grid points NDFD winds too strong and RUC winds too strong as well Verification at ~2000 Obs. Locations
Where Do We Have Greater Confidence in the ADAS Analysis? White Regions- No observations close enough to adjust the RUC background ADAS confidence regions defined where total weight > .25 Varies: diurnally, from day-to-day, between variables
Gridded Validation of NDFD Forecasts • RUC downscaled to NDFD grid using NDFD terrain • ADAS analysis performed on NDFD grid • Statistics based upon areas where sufficient observations to have “confidence” in the analysis denoted as “ADAS_C”
48 h Forecast Temperature Bias (NDFD – Analysis)00z 18 Nov.-23 Dec. 2003 NDFD-RUC NDFD-ADAS
48 h Forecast Temperature RMS Difference (NDFD – Analysis)00z 18 Nov.-23 Dec. 2003 RUC ADAS
Average 00Z Dewpoint and Wind Speed Dewpoint Wind Speed
48 h Forecast RMS Difference (NDFD – Analysis)00z 18 Nov.-23 Dec. 2003 Dewpoint Wind Speed
No difference when verification limited to areas where higher confidence in the ADAS analysis
Lower confidence in analysis of dewpoint temperature
NDFD has higher speed bias in regions with observations
Arctic Outbreak: 21-25 November 2003 NDFD and ADAS sample means removed NDFD 48 h forecast ADAS Analysis
Solid-ADAS Dashed-ADAS_C
Solid-ADAS Dashed-ADAS_C
Solid-ADAS Dashed-ADAS_C
Summary • Assimilation of surface data is critical for generating and verifying gridded forecasts of surface parameters • MDL is using RUC for national NDFD validation and is exploring use of ADAS in the West • Differences between ADAS analysis and NDFD forecast grids result from combination of analysis and forecast errors • Difference between ADAS temperature analysis on 5 km grid and station observations is order 1.5-2C • Difference between NDFD temperature forecast and ADAS temperature analysis is order 3-6C • Anomaly pattern correlations between NDFD and ADAS temperature grids over the western United States suggest forecasts are most skillful out to 48 h • Little difference in NDFD skill when evaluated over areas where analysis confidence is higher • Major issue for NDFD validation: true state of atmosphere is unknown • Specific issues for NDFD Validation in Complex Terrain • Scales of physical processes • Analysis methodology • Validation techniques
Issues for NDFD Validation in Complex Terrain • Physical Process: • Horizontal spatial scales of severe weather phenomena in complex terrain often local and not sampled by NDFD 5 km grid • Vertical decoupling from ambient flow of surface wind during night is difficult to forecast. Which is better guidance: match locally light surface winds or focus upon synoptic-scale forcing?
Issues for NDFD Validation in Complex Terrain • Analysis Methodology • Analysis of record will require continuous assimilation of surface observations, as well as other data resources (radar, satellite, etc.) • Requires considerable effort to quality control observations (surface stations siting issues, radar terrain clutter problems, etc.) • Quality control of precipitation data is particularly difficult • NWP model used to drive assimilation must resolve terrain without smoothing at highest possible resolution (2.5 km) • NCEP proposing to provide analysis of record for such applications
Issues for NDFD Validation in Complex Terrain • Validation technique: • Upscaling of WFO grids to NDFD grid introduces sampling errors in complex terrain • Which fields are verified? • Max/min T vs. hourly temperature? • Max/min spikes • fitting of sinusoidal curve to Max/Min T to generate hourly T grids • instantaneous/time average temperature obs vs. max/min • Objectively identify regions where forecaster skill limited by sparse data
Ongoing and Future Work • Submit paper on ADAS evaluation of NDFD grids • Make available simplified ADAS code suitable for use at WFOs in GFE • Develop variational constraint that adjusts winds to local terrain • Improve anisotropic weighting • Implement national ADAS verification grid? • Collaborate with MDL and NCEP on applications of MesoWest observations and ADAS • Meeting on action plan for analysis of record in June?