Download
1 / 21
210 likes | 229 Vues
This study analyzes the Tropospheric Emission Spectrometer (TES) and Atmospheric Chemistry Experiment (ACE) measurements during the 2006 El Niño in Southeast Asia, focusing on the increased emissions and changes in tropospheric chemistry. The comparison between TES and ACE provides insights into the consistency of the results obtained by both instruments.

E N D
Tropospheric Emission Spectrometer (TES) and Atmospheric Chemistry Experiment (ACE) Measurements of Tropospheric Chemistry in tropical southeast Asia during a moderate El Niño in 2006
El Niño 2006 • El Niño is an abnormal warming of surface ocean waters in the eastern tropical Pacific, which often brings a significant shift in global weather patterns • As rain fall sharply decreased during the last quarter of 2006 across the dense tropical rainforests of Sumatra, Kalimantran, and Malaysia, the land became exceptionally dry, releasing large amount of soot and tiny dust particles (aerosols) throughout the region • Increased emissions occurred due to wildfires that quickly spread across the region during September through November primarily from burning of thick peat deposits, giving rise to enhanced emissions of CO, CO2, and other biomass burning products • Emissions were the largest in the region since the El Niño even 1997-1998 with increased CO emissions that have been noted by the MOPITT and TES instruments • ACE measured profiles for CO and other molecules were recorded during 10 occultations in the region (20°S-20°N, 70°E-100°E) for the same months and show significantly higher upper tropospheric mixing ratios during October 2006 than during October 2005 • Both TES and ACE are high resolution Fourier transform spectrometer but the two instruments uses different retrieval techniques (optical estimation for TES vs. nonlinear least squares for ACE) with different sets of windows and geometry (solar occultation vs. nadir emssion) and the comparison provides an opportunity to quantify the consistency of the results from both instruments
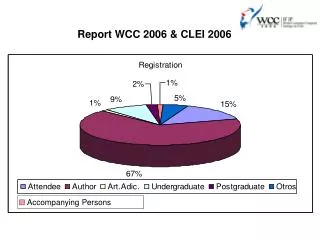
Comparison Results • TES-ACE at 215 hPa = (1.9±16.6)%-1289 coincidences • TES-ACE at 316 hPa = (7.4±21.2)%-720 coincidences • TES-ACE at 511 hPa = (16.7±14.3)%-21 coincidences
ACE Mission and Status • ACE is a Canadian-lead mission successfully launched into a 74º inclined orbit by a U.S.-supplied Pegasus launch vehicle on August 12, 2003 • The primary instrument is a Fourier transform spectrometer (FTS) operating in solar occultation mode • Additional measurements are obtained in the visible with two arrays and a UV-Visible spectrometer • FTS spectral coverage of 750-4500 cm-1 often with measurements of multiple bands for a molecule providing consistency tests of spectroscopic parameters • Spectra are recorded with a maximum optical depth of 25 cm and a scan time of 2 s and provide 3-4 km vertical resolution • Instrument is continuing to operate well and has provided an order of magnitude more measurements than ATMOS during its four shuttle flights • Total payload mass 250 kg with a design lifetime of 2 years
Global Coverage Latitude /degrees 650 km, 74° inclined circular orbit, RAAN 55.7° Jan. 1, 2004 to Dec. 29, 2004
SNR Performance InSb MCT
Advances • ATMOS used 13 filters to record the infrared from 650-4800 cm-1 at 0.01 cm-1 resolution with a single HgCdTe detector • Filters limited the spectral coverage for a each occultation • ACE-ATMOS overlap in spectral coverage provide the potential for long-term trend studies from the combined dataset • ACE combines a HcCdTe detector with a photovoltaic detector to obtain simultaneous infrared coverage from 740-4500 cm-1 • MAESTRO spectrometer and imagers with filters yield 280 to 1020 nm coverage • Satellite mission provides continuous series of measurements compared to limited coverage from two week shuttle missions
Key ACE Measurements • CH3OH (Methanol) • Dufour et al. ACP, 6, 3463-3470, 2006 • Most abundant organic molecule after CH4 in the troposphere • Paper on the global distribution of CH3OH in preparation for submission to Geophysical Research Letters • HFC134a • HCOOH • CFC-113 • COClF • H2O2 • H2CO (Formaldehyde) • PAN • Acetone
Version 2.2 Standard Products • H2O • O3 • N2O • CO • CH4 • NO • NO2 • HNO3 • HF • HCL • CLO • OCS • HOCL • H2O2 • HO2NO2 • N2O5 • CLONO2 • HCN • CH3CL • CF4 • CCL2F2 • CCL3F • CCL4 • COF2 • C2H6 • C2H2 • N2 • CHF2CL • HCOOH • SF6 • H2O(181) • H2O(171) • H2O(162) • Temperature
Precise Determination of Density from N2 Continuum Extinction
Precise Determination of Density from N2 Continuum Extinction
Summary and Conclusions • ACE continues to provide a wealth of high precision measurements of the middle-upper troposphere to lower thermosphere with more than 30 molecular species and temperature providing high precision measurements for a wide range of studies such as air quality, trend quantification and verification of international protocols • Profile measurements provide tests of the precision and accuracy of current spectroscopic parameters • Key measurements are provided for science and validation of spaceborne instruments (e.g. MOPITT, MIPAS, SCIAMACHY, Aura, AIRS), and simultaneous observations for climate change studies • There is a concern a gap will occur as SAGE II, SAGE III, HALOE, and POAM III instruments are no longer operating with no plans for replacements