Download
1 / 1
10 likes | 108 Vues
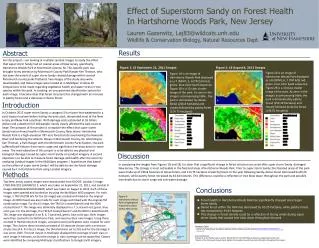
Explore the impact of Superstorm Sandy on forest health in Hartshorne Woods Park, New Jersey using Landsat imagery. Analyze changes in forest structure post-storm and assess vegetation health.

E N D
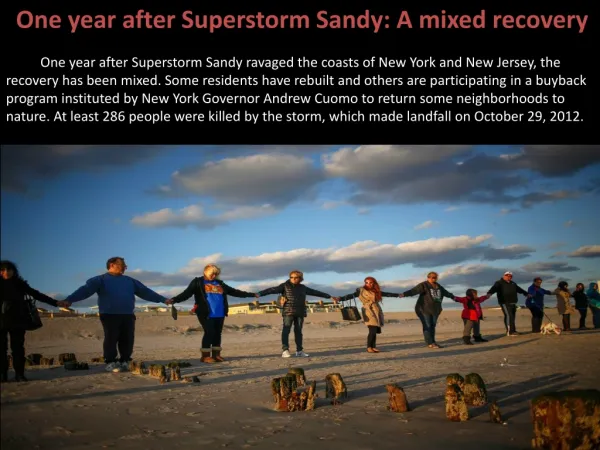
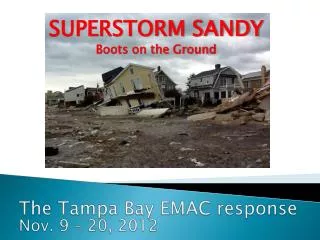
Effect of Superstorm Sandy on Forest Health In Hartshorne Woods Park, New Jersey Lauren Gazerwitz, Laj83@wildcats.unh.edu Wildlife & Conservation Biology, Natural Resources Dept. Results Abstract For this project, I am looking at multiple Landsat images to study the effect that super storm Sandy had on coastal areas of New Jersey, specifically, Hartshorne Woods Park in Monmouth County, NJ. This specific park was brought to my attention by Monmouth County Park Ranger Ken Thoman, who has seen the extent of super storm Sandy-related damage within several Monmouth county parks firsthand. Two images of the study area were downloaded, and these images were looked at in MultiSpec to allow for comparisons to be made regarding vegetative health and water stress in tree species within the park. In creating an unsupervised classification system for each image, it became clear that forest structure has changed with an increase in patchy forest and a decrease in dense forest. Figure 1: L5 September 21, 2011 Images Figure 2: L8 August 8, 2013 Images Figure 2A is an image of Hartshorne Woods Park displayed as a 8 (NDVI), 6, 7 (TM 6/5) red, green, blue color band sequence. Figure 2B is a 10 class cluster image of the park. As seen in the image’s accompanying table, the park is dominated by patchy forest (159.39 hectares) and closely followed by dense forest (143.55 hectares) Figure 1A is an image of Hartshorne Woods Park displayed as a 7 (NDVI), 5, 6 (TM 5/4) red, green, blue color band sequence. Figure 1B is a 10 class cluster image of the park. As seen in the image’s accompanying table, the park is dominated by dense forest (226.8 hectares) and closely followed by patchy forest (114.75 hectares) A A Introduction In October, 2012 super storm Sandy, a category 3 hurricane that weakened to a post-tropical cyclone before hitting the east coast, devastated most of the New Jersey and New York coastlines. With damage costs estimated at 55 billion dollars and a death toll of 160 people, Sandy clearly affected the east coast at large. The purpose of this project is to explore the effect that super storm Sandy had on forest health in Monmouth County, New Jersey. Hartshorne Woods Park is a high-elevation 787-acre forested site overlooking the Navesink River and bordering the Atlantic Ocean in Monmouth County, NJ. According to Ken Thoman, a Park Ranger with the Monmouth County Parks System, the park suffered bank failures from storm surge and significant tree blow down in some areas. The main objective of this project is to be able to see physical and biological damage caused by super storm Sandy on Landsat imagery. A second objective is to be able to measure forest damage and health after the storm by analyzing Landsat images in the MultiSpec program. I hypothesize that based on the caliber of super storm Sandy I will be able to see the forest damage caused by it in Hartshorne Park using Landsat imagery. Cover (In hectares) 94.68 8.01 37.53 12.78 45.09 70.38 159.39 143.55 23.31 18.72 Cover (In hectares) 110.97 18.63 27.72 40.5 52.02 41.22 60.75 114.75 226.8 26.64 B B Discussion In comparing the images from Figures 1B and 2B, it is clear that a significant change in forest structure occurred after super storm Sandy damaged New Jersey. This change is most noticeable in the forested areas of Hartshorne Woods Park. Prior to super storm Sandy, the forested areas of the park were made up of 226.8 hectares of dense forest, and 114.75 hectares of patchy forest. In the year following Sandy, dense forest decreased by 83.25 hectares, while patchy forest increased by 44.64 hectares. This difference could be a reflection of tree blow down throughout the park and possible tree death due to storm surge and salt-water damage. Methods Two New Jersey coastal images were downloaded from GLOVIS: Landsat 5 image LT50140322011243GNC01 2, which was taken on September 21, 2011, and Landsat 8 image LC80140322013232LGN00, which was taken on August 8, 2013. Each of these images were opened and worked on by using the MultiSpec W32 program. For each image, a TM 5/4 (TM 6/5 for the L8 image) was created and linked to the original image. An NDVI band was also made for each image and linked with the original-TM combination image. For the L5 image, the TM 5/4 created band 6 and the NDVI created band 7. This image was ultimately displayed in a 7, 5, 6 band red, green, blue color gun. For the L8 image, the TM 6/5 created band 7 and the NDVI created band 8. This image was displayed in an 8, 6, 7 band red, green, blue color gun. Both images were then zoomed in to Hartshorne Park, and saved as their own images. Using these zoomed in Hartshorne park images, unsupervised classifications were created for each image. The clusters these created consisted of 10 separate classes with a minimum cluster size of 4. For the L5 image, the threshold was set to 255 and for the L8 image it was set to 1500. The text output in Multispec displayed the coverage of each class in each image in hectares, so that the change in class coverage can be quantified. Classes were identified by comparing Multispec classifications to Google Earth imagery. Conclusions Figure 3: Hartshorne Woods Park’s (highlighted in green) location within New Jersey Forest health in Hartshorne Woods Park has significantly changed since Super storm Sandy Dense forest within the Park has decreased by 83.25 hectares, while patchy forest has increased by 44.64 hectares This change in forest density could be a reflection of strong winds during super storm Sandy that caused tree blow down throughout the park • Literature Cited • Monmouth County Parks System. (2011). Hartshorne Woods Park. Retrieved on October 20, 2013 from http://www.monmouthcountyparks.com/page.aspx?Id=2524 • Sharp, T. (2012). Superstorm Sandy: Facts about the Frankenstorm. Live Science. Retrieved November 26, 2013 from http://www.livescience.com/24380-hurricane-sandy-status-data.html Acknowledgments Thank you to Dr. Martha Carlson and Dr. Barrett Rock of the UNH Natural Resources Department and to Ken Thoman of the Monmouth County Parks System for providing me with help and information throughout this project.