VOCALS - Ocean Science and Implementation
250 likes | 274 Vues
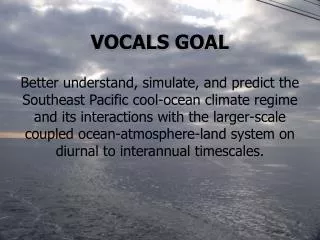
VOCALS - Ocean Science and Implementation. An eastern boundary - model biases - cloud cover - ocean-atmosphere. The ocean setting - the Southeast Pacific (SEP). Persistent trade winds, coastal upwelling. Trade winds - directionally steady but vary in speed, with periods of low winds

VOCALS - Ocean Science and Implementation
E N D
Presentation Transcript
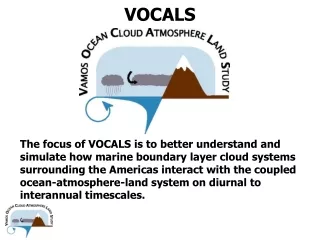
An eastern boundary - model biases - cloud cover - ocean-atmosphere
The ocean setting - the Southeast Pacific (SEP) • Persistent trade winds, coastal upwelling. • Trade winds - directionally steady but vary in speed, with periods of low winds • Low level of synoptic weather systems • Peru/Chile Current flowing north and northwest.
• A strongly evaporative, moderately warmed region producing temperate, salty surface water. • Fresher water moving in below the surface layer. • Below that a more saline layer and a second salinity minimum. • VOCALS’ goal of understanding controls on SST sets a focus on the surface layer • VOCALS partners (Chile,Peru, France - PRIMO) interest is on the oxygen minimum layer below The ocean setting 20°S, 85°W
Annual cycle in the upper ocean under the stratus deck Diurnal restratification SST Temp(z)
Pilot studies: To what extent are SST and upper ocean structure predictable from surface forcing alone?
Model-based surface fluxes are not accurate, for example, NCEP1 suggests a longer, cooler winter and little net heating of the ocean. Annual net heat ranges from Buoy - more ocean gain than models, NCEP shows a loss NCEP stress 30% stronger Models: rain (.07 to .3 m yr-1) Buoy: no rain to .03 m yr-1 Buoy SOC NCEP ECMWF
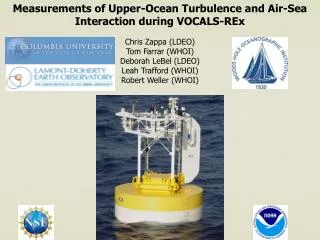
Surface forcing from buoy driving a one-dimensional ocean model (PWP) produces a surface layer that is too warm and too salty. ) Weller
Additional cooling and freshening is needed. Possible mechanisms:- Ekman (wind-driven surface layer) transport offshore of coastal water- Open ocean downwelling/upwelling (Ekman pumping)- Mixing with low saline water below- Geostrophic currents (advection)- Eddy processes, including horizontal transport enhanced vertical mixing Remote as well as local forcing is possible, possible links to ENSO variability. - Kelvin waves->coastal waves-> Rossby waves - Displacement of S Pacific high pressure center Integrated Heat Content Equation Surface Flux Advection Ekman Pumping Eddy Flux Divergence Vertical Diffusivity
1000 500 130 m 0 Distance (km) -500 10 m – 130 m -1000 20 m – 130 m -1000 Distance (km) 0 500 Steady Trade Winds to the NW, wind-driven surface flow to the Southwest One-year displacements or progressive vector diagrams of velocities at 10 and 20 m relative to that at 130 m, as well as for the velocity at 130 m. The surface water moves offshore under the influence of the wind.
~1 cm/sec ~ 3 cm/sec 3 year displacement at 10 m depth, a mean of ~ 3 cm/sec 3 year displacement at 350 m depth, a mean of ~ 1 cm/sec In upper thermocline, 1-2 cm/sec annual mean Flows to NW.
QuikScat winds and TMI SST fields used to estimate the advective component of heat flux due to Ekman transport across SST gradients. Calculation done for weekly fields and then combined to get an annual average. The steadiness of the winds implies that the mean of the high-frequency product is close to the product of the means. Ekman Advection along SST gradients Color Contours: Annually averaged component of the heat flux due to advection by Ekman transport Gray Contours: Annually averages SST Arrows: Annually averaged Ekman transport Ekman Advection = 6 +/- 5 W/m2
Best estimates of heat balance at Stratus mooring, 20°S, 85°W in a volume down to 250m. Major terms: surface heating, geostrophic advection, eddy divergence.
Low salinity AAIW Top of O2 min layer Geostrophic advection from SW - heat, salt Eddy flux from the coast - heat, salt, nutrients Vertical mixing between upper thermocline and surface mixed layer Vertical exchange between surface layer and oxygen minimum layer
wind radiation bar pres SST Air temp Power spectrum of net heat flux. Rel hum Of concern: Diurnal variability in forcing and in response. rain Low wind period - diurnal response
diurnal Of concern: diurnal and near-inertial ocean 30 20 10 0 -10 -20 -30 -40 -50 North (cm s-1) Near-inertial One month of upper ocean velocity (15 to 125 m) data at the Stratus mooring from an acoustic Doppler velocity profiler. Note at the surface, a diurnal (24 hour) cycle in the depth of the scattering layer modulates Doppler return. Below the surface layer, near-inertial (36 hour) oscillations are evident; these play a role in mixing.
Altimetric satellites show westward propagating eddies are typical of the region. S-P Xie Weller
6 main sections, 250-300 nm • 114 stations, 1000m or less • 4 stations to the bottom • 1 « radiator », 100 nm • Total time: 37 days • Including: • 7 x 2-day BGC fixed stations • 1 deep-core • --------------------------------------- • Existing moorings • Future ADCP mooring • (pos. to be defined)
VOCALS ocean implementation: Regional scale, annual cycle: - Argo float, surface drifter - Lagrangian tracking of eddy by sea gliders - Satellite - Model comparisons High time, high vertical resolution, time series at two contrasting sites with accurate surface fluxes: - Stratus (20°S, 85°W) NOAA Climate Obs - ongoing - Chilean Tsunami (DART) buoy (20°S, 75°W) - Oct 2006-Oct 2008 (turn around planned for Oct 2006) Vertical mixing processes at Stratus and DART sites over diurnal and near-inertial cycles: - Microstructure profiling for 6-10 days at each - Near-surface profilers to resolve diurnal layer
VOCALS ocean implementation: • Mesocale sampling - the role of the eddies: • - SeaSoar surveys at Stratus, DART, coastal sites • - Sea glider deployment for one year • - XBT, ADCP sections • Partnering • Ongoing NOAA Climate Observation Program • SOLAS • PRIMO • Chilean coastal program
summary • Coupled atmosphere-ocean models • Tested across regimes, coastal upwelling to open ocean, offshore weak downwelling, eddy-influenced • Tested at sites (Stratus buoy, DART) at different phases of diurnal subsidence wave, different aerosol regimes • Clear separation of surface layer from upper thermocline • Surface fluxes at 3 sites (also San Felix) • Coupled physics-biology ocean models • Ability to get surface layer, oxygen minimum layer • Ability to get offshore nutrient transport • DMS production, impacts on optical absorption
Surface fluxes and ocean structure and evolution: Addressing model (atmospheric, coupled atmosphere-ocean, coupled physics-biology) performance in a region spanning several regimes