Download
1 / 30
300 likes | 415 Vues
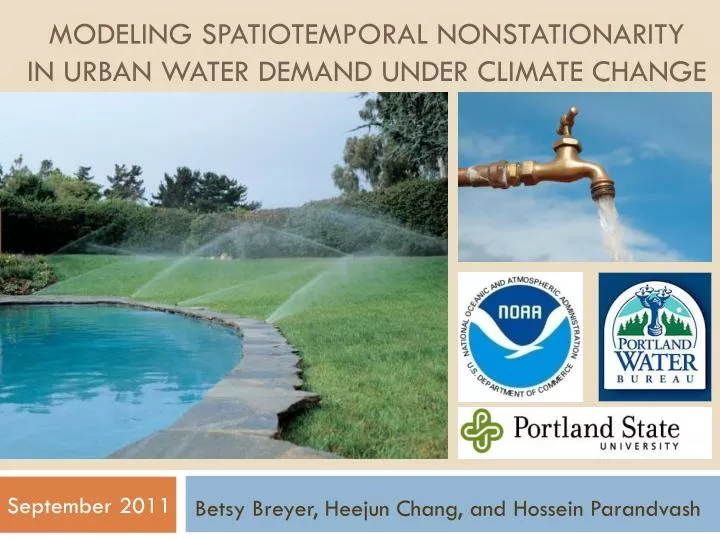
Modeling Spatiotemporal Nonstationarity in Urban Water Demand Under Climate Change. September 2011. Betsy Breyer , Heejun Chang, and Hossein Parandvash. Background. Adaptation to climate change requires an understanding how current behavior depends on climate variation

E N D
Modeling Spatiotemporal Nonstationarityin Urban Water Demand Under Climate Change September 2011 Betsy Breyer, Heejun Chang, and HosseinParandvash
Background • Adaptation to climate change requires an understanding how current behavior depends on climate variation • For urban water providers, water demand analysis is key to formulating an adaptation strategy • Neighborhood-level conservation planning can help reduce risk of municipal water shortages
Research questions • How does climate affect residential water demand?
Research questions • How does climate affect residential water demand? • How is the relationship between climate and water nonstationary? How does it vary over space?
Research questions • How does climate affect residential water demand? • How is the relationship between climate and water nonstationary? How does it vary over space? • How does the relationship between climate and water use vary during wet/dry years?
Research questions • How does climate affect residential water demand? • How is the relationship between climate and water nonstationary? How does it vary over space? • How does the relationship between climate and water use vary during wet/dry years? • How can we use the above information to forecast future water use under climate change?
Water Use Historical water use Max. Temp. Base use 2002 2003 2004 2005 2006 2007 2008 2009
Independent Variable: Max. temp. Monthly household water use (KL) Mean max. temp. (C)
Mean building size: 241 m Mean building age: 12.3 years Mean outdoor space: 5077 m 2 2
Mean building size: 241 m Mean building age: 12.3 years Mean outdoor space: 5077 m 2 2
2 Mean building size: 197 m Mean building age: 97.6 years Mean outdoor space: 961 m 2
2 Mean building size: 197 m Mean building age: 97.6 years Mean outdoor space: 961 m 2
Low vs. high density: temperature response coefficient SDF Low Density High Density
Variation in temperature coefficient depends on density Max. temp coefficient Global mean = 0.443 Low Med-Low Med-High High Density
Coefficient Distribution: July 2002-09 SDF 3.0 2.5 2.0 Check labels 1.5 1.0 0.5 0.0 H MH ML L DRY H MH ML L NORMAL H MH ML L WET
Key findings • Generally, a 1⁰ C 0.443 KL increase monthly per household • Local regression: water use in lower density areas tends to be more climate-sensitive • Some medium density areas as sensitive to temp. increases as low-density, esp. during dry years
Future climate change scenario AB1 SDF Monthly household water use (KL)
Next steps • Run spatial-temporal weighted regression model to improve model of localized variations in water use • Establish threshold temperatures to better capture nonlinear variations during peak use in summer • Link climate change scenarios with regional growth/land cover change scenarios through 2050
Household water use and max. temp. Monthly household water use (KL) Mean max. temp. (C)
Conclusions • Countervailing trends: - declining household-level base use - climate-driven increases in seasonal use • Portland is most vulnerable to climate-induced water stress along its urban fringe in normal years • High density areas show the greatest resilience to climate variation in drought years