Download
1 / 28
400 likes | 893 Vues
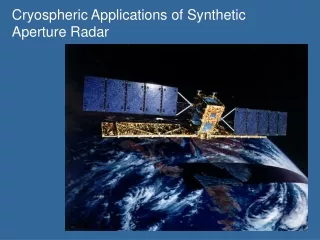
Synthetic Aperture Radar. Material from: SAR Light Lectures by J.J.Mohr ESA TM-19 A,B,C. Skagen Investigation DESCW - ESA. Synthetic Aperture Radar. Synthetic Aperture Radar. Synthetic Aperture Radar. Synthetic Aperture Radar. Synthetic Aperture Radar.

E N D
Synthetic Aperture Radar. • Material from: • SAR Light Lectures by J.J.Mohr • ESA TM-19 A,B,C. • Skagen Investigation • DESCW - ESA C.C.Tscherning, Sat_geoph11, lec_day_10_1.ppt, 2013-12-21.
Synthetic Aperture Radar. C.C.Tscherning, Sat_geoph11, lec_day_10_1.ppt, 2013-12-21.
Synthetic Aperture Radar. C.C.Tscherning, Sat_geoph11, lec_day_10_1.ppt, 2013-12-21.
Synthetic Aperture Radar. C.C.Tscherning, Sat_geoph11, lec_day_10_1.ppt, 2013-12-21.
Synthetic Aperture Radar. C.C.Tscherning, Sat_geoph11, lec_day_10_1.ppt, 2013-12-21.
Synthetic Aperture Radar. C.C.Tscherning, Sat_geoph11, lec_day_10_1.ppt, 2013-12-21.
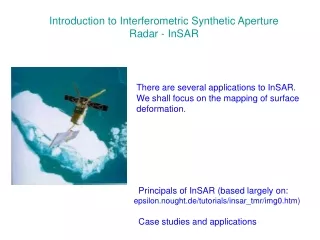
Synthetic Aperture Radar Interferometry. C.C.Tscherning, Sat_geoph11, lec_day_10_1.ppt, 2013-12-21.
Synthetic Aperture Radar Interferometry. C.C.Tscherning, Sat_geoph11, lec_day_10_1.ppt, 2013-12-21.
Synthetic Aperture Radar Interferometry. C.C.Tscherning, Sat_geoph11, lec_day_10_1.ppt, 2013-12-21.
Synthetic Aperture Radar Interferometry. C.C.Tscherning, Sat_geoph11, lec_day_10_1.ppt, 2013-12-21.
Synthetic Aperture Radar Interferometry. C.C.Tscherning, Sat_geoph11, lec_day_10_1.ppt, 2013-12-21.
SAR Differential Interferometry. C.C.Tscherning, Sat_geoph11, lec_day_10_1.ppt, 2013-12-21.
Synthetic Aperture Radar Interferometry. C.C.Tscherning, Sat_geoph11, lec_day_10_1.ppt, 2013-12-21.
Synthetic Aperture Radar Interferometry. C.C.Tscherning, Sat_geoph11, lec_day_10_1.ppt, 2013-12-21.
benchmarks June 13, 2006 17
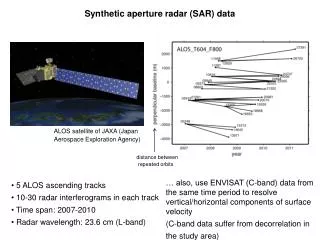
SAR data • Finally selected scenes from tracks 065 and 315
PSI procesing of descending stack Master orbit: 06933
Master Image Orbit: 06933 Date: 17-Aug-1996 Sensor: ERS-2 Orbit:
SIR-C/X data (Just to check) C-band Sensor: SIR – C, L Incidence angle: 39.721 Date: 04-Oct-1994 Colors: R: HH component G: TP (total power) B: VV component L-band
Processing difficulties - coregistration Coregistration of the area is not straightforward. (Resampling polynomial is not well-confined due to the incoherent water areas.) The placement of fine coregistration windows has been limited only to land areas. After quite some manual fine tuning, the results were satisfactory. The coordinates of the window centres have been stored in the file coreg_points.txt and introduced within the processing. FC_IN_POS doris card
InSAR and PSI processing • 38 ERS-1/2 SAR images • Image crop of 10200 X 2200 pixels has been processed • 36 interferograms used for PS processing, some examples:
Processing problems -PSI Masked areas over the sea PSC network – after applying the masking
Preliminary results • The first reasonable result of the descending stack processing • Good coverage of Skagen town • However, the main problem is the lack of coherent points on the main arm of the peninsula. This results in a weak connection of the tip of the peninsula to the main land. Many arcs are still rejected • Therefore, the color differences between Skagen city and the rest of the area should not yet be quantitatively interpreted.
Preliminary results • The points detected within Skagen city suggest that the highest subsidence rates are between the harbor area and the village The subsidence velocity of the harbour relative to the city is about 8-10 mm/year • However, due to weak connection within the network the subsidence rate between Skagen city and the mainland is still not well defined • We are currently trying different manual tricks to obtain at least some coherent arcs in this area.
Conclusions • Interferometric processing OK (Problems in coregistration were solved) • Coherent information over village and build-up areas • Poor connection between coherent patches: many rejected arcs • Improvement of connection still ongoing • Relative subsidence of Skagen harbor detected of 8-10 mm/y