Download
1 / 5
50 likes | 159 Vues
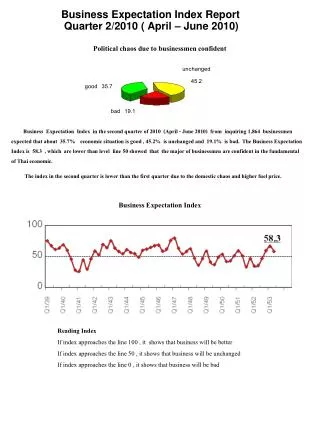
Business Expectation Index Report Quarter 2/2010 ( April – June 2010). Political chaos due to businessmen confident.

E N D
Business Expectation Index Report Quarter 2/2010 ( April – June 2010) Political chaos due to businessmen confident Business Expectation Index in the second quarter of 2010 (April - June 2010) from inquiring 1,864 businessmen expected that about 35.7% economic situation is good , 45.2% is unchanged and 19.1% is bad. The Business Expectation Index is 58.3 , which are lower than level line 50 showed that the major of businessmen are confident in the fundamental of Thai economic. The index in the second quarter is lower than the first quarter due to the domestic chaos and higher fuel price. Business Expectation Index Reading Index If index approaches the line 100 , it shows that business will be better If index approaches the line 50 , it shows that business will be unchanged If index approaches the line 0 , it shows that business will be bad
Business Expectation Index in Quarter 2/2010 Business Performance Index Cost Expectation Index Employment Expectation Index Business Expansion Expectation Index
Regions Business Situation Expectation Index in Quarter 2 / 2010 1 = Bangkok Metropolitan and Vicinity 2 = The Central 3 = The Northern 4 = The Eastern 5 = The North - Eastern 6 = The Southern Business Sectors Performance Expectation Index in Quarter 2 / 2010 1 = Agricultural Sector 2 = Industrial Sector 3 = Commercial Sector 4 = Construction Sector 5 = Financial and insurance Sector 6 = Service Sector
Commentary 1. Business situation The domestic political problems are the main factor to affect Thai economic. 2. Sub sector business situation Agricultural: The Global warming and the drought affect to the agricultural products. Industrial: The baht appreciation affect to the competitiveness in the World market. Commercial: Consumer are carefully paid affecting to the trade slowdown Construction: The mega-projects are slowdown and the lower house repair due to the higher cost of living. Financial: The strong financial sector affect to the confident in business operation. Service: The tourist sector was affected by the political chaos. 3. Business Performance : The higher competitors but the lower profit per unit. 4. Cost per unit of goods and services : The higher cost per unit due to the shortage of raw materials and the higher of fuel price 5. Employment : The shortage of labours in many industries including the higher wage but lower ability. 6. Expansion of business : The business expansion is low due to the lack of confidence in economic and politic. Suggestions 1. Baht appreciation affect to the export sector. 2. Providing the soft loan for SMEs. 3. Solving the Map-Ta-Phut problems. 4. Promoting the ecotourism such as planting ,way of life and culture. 5. Supporting the profession and developing the campaigns. 6. Publicizing and creating the consumer confidence in economic growth. 7. Monitoring the price of consumer products. 8. Preparing the personnel to support the ASEAN in 2010 – 2015 ,including to provide the information to businessmen. 9. Maintaining the peaceful in nation. 10. Speeding the retail and wholesale laws and regulations in order to protect the retailers. 11. Investing in infrastructure and logistic. 12. Stimulating the budget to the regions transparently. 13. Monitoring the drought and irrigation system.
Annex • Population Sampling • Bangkok Metropolitan and Vicinity (6 provinces) - Bangkok, Samut Prakan, Pathum Thani, Samut Sakhon, Nakhon Pathom and Nonthaburi total 216 units • The Central (13 provinces) - Saraburi, Phra Nakhon Si Ayutthaya, Rachaburi, Lop Buri, Phetchaburi, Kanchanaburi, Sing Buri, Suphan Buri, Samut Songkhram, Ang Thong, Chai Nat, Prachuap Khiri Khan and Nakhon Nayok total 303 units • The Northern (17 provinces) - Chiang Rai, Chiang Mai, Lampang, Tak, Phitsanulok, Phrae, Phetchabun, Nakhon Sawan,Uttaradit, Lamphun, Nan, Phayao, Mae Hong Son, Uthai Thani, Sukhothai, Phichit and Kamphaeng Phet total 439 units • The Eastern (7 provinces) - Chon Buri, Rayong, Chanthaburi, Phrachin Buri, Trat, Chachoengsao and Sa Kaeo total 96 units • The North- Eastern (19 provinces) - Ubon Ratchathani, Nong Khai, Khon Kaen, Nakhon Ratchasima, Mukdahan, Surin, Roiet, Udon Thani, Si Sa Ket, Kalasin, Buri Ram, Yasothon, Chaiyaphum, Sakon Nakhon, Nakhon Phanom, Nong • Bua Lam Phu, Loei, Amnat Charoen and Maha Sarakham total 444 units • The Southern (14 provinces) - Surat Thani, Trang, Phuket, Songkhla, Nakhon Si Thammarat, Krabi, Narathiwat, Yala, Chumphon, Phangnga, Ranong, Satun, Patthalung and Pattani total 370 units • Time duration • Operation to survey every three month and this quarter (the first quarter, between January – March 2010) • had surveyed in March 2010, and received 1,874 questionnaires. All questionnaires were out of controlling 6 units or they are 0.3%. Then, there are correct 1,868 questionnaires. • Compiling the data and Conducting the index • In quarter 1/2010, compiling was set on 21 April 2010 and was divided into 2 patterns • 1. Percentage proportion : to make in percentage proportion by using every answer in questionnaire • ( better, unchange and bad) • 2. Calculate in index form : to use the results of surveying and making diffusion index that shows 3 answers • (better, unchange and bad) • Step of calculating • to translate raw quality data to quantity data • If raw quality data shows “better/increase”, score will be 1 , If raw quality data shows “unchange”, score will be 0.5, • If raw quality data shows “bad/decrease”, score will be 0 • using the estimated percentage on “better” + “unchange” that is divided by 2 • index = % better + ( % unchange / 2 ) • Reading Index • If index approaches the line 100 , it shows that business will be better • If index approaches the line 50 , it shows that business will be unchange • If index approaches the line 0 , it shows that business will be bad • If the index is above the line 50, it shows that the business situation’s still expand. If the index is across down the line 50, • it means that the business situation is bad or recession. If the index is under the line 50, it shows that the business situation • is in recession period. If the index is across upward the line 50, it means that the business situation is better or recovery. • ---------------------------------------- Bureau of Trade and Economic Indices, Ministry of Commerce. Tel. 0 2507 5811-3 Fax. 0 2507 5806 www.price.moc.go.th