Observing Massive Black Hole Binaries with LISA
20 likes | 120 Vues
Explore gravitational wave data from numerical simulations to analyze binary black hole coalescences with LISA's capabilities, including waveform accuracy and parameter extraction techniques.

Observing Massive Black Hole Binaries with LISA
E N D
Presentation Transcript
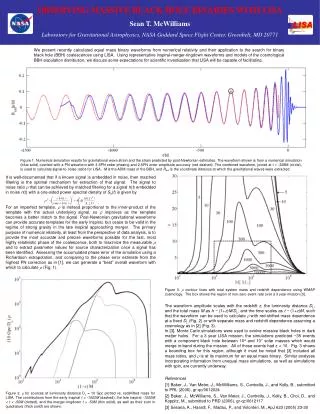
OBSERVING MASSIVE BLACK HOLE BINARIES WITH LISA Sean T. McWilliams Laboratory for Gravitational Astrophysics, NASA Goddard Space Flight Center, Greenbelt, MD 20771 We present recently calculated equal mass binary waveforms from numerical relativity and their application to the search for binary black hole (BBH) coalescences using LISA. Using representative inspiral-merger-ringdown waveforms and models of the cosmological BBH population distribution, we discuss some expectations for scientific investigation that LISA will be capable of facilitating. Figure 1. Numerical simulation results for gravitational wave strain and the strain predicted by post-Newtonian estimates. The waveform shown is from a numerical simulation (blue solid) overlaid with a PN waveform with 3.5PN order phasing and 2.5PN order amplitude accuracy (red dashed). The combined waveform, joined at t = -328M (circle), is used to calculate signal-to-noise ratios for LISA. M is the ADM mass of the BBH, and Rext is the coordinate distance at which the gravitational waves were extracted. It is well-documented that if a known signal is embedded in noise, then matched filtering is the optimal mechanism for extraction of that signal. The signal to noise ratio r that can be achieved by matched filtering for a signal h(t) embedded in noise n(t) with a one-sided power spectral density of Sh(f) is given by . For an imperfect template, r is instead proportional to the inner-product of the template with the actual underlying signal, so r improves as the template becomes a better match to the signal. Post-Newtonian gravitational waveforms can provide accurate templates for the early inspiral, but cease to be valid in the regime of strong gravity in the late inspiral approaching merger. The primary purpose of numerical relativity, at least from the perspective of data analysis, is to provide the most accurate and precise waveforms possible for the last, most highly relativistic phase of the coalescence, both to maximize the measurable r and to extract parameter values for source characterization once a signal has been identified. Assessing the accumulated phase error of the simulation using a Richardson extrapolation, and comparing to the phase error estimate from the highest PN correction as in [1], we can generate a “best” overall waveform with which to calculate r (Fig. 1). Figure 3. r contour lines with total system mass and redshift dependence using WMAP cosmology. The box shows the region of non-zero event rate over a 3 year mission [3]. The waveform amplitude scales with the redshift z, the luminosity distance DL, and the total mass M as h ~ (1+z)M/DL, and the time scales as t ~ (1+z)M, such that the waveform can be used to calculate r with red-shifted mass dependence at a fixed DL (Fig. 2) or with separate mass and redshift dependence assuming a cosmology as in [2] (Fig. 3). In [3], Monte Carlo simulations were used to evolve massive black holes in dark matter halos. For a 3 year LISA mission, the simulations predicted ~35 events with a component black hole between 104 and 107 solar masses which would merge in-band during the mission. All of those events had z < 10. Fig. 3 shows a bounding box for this region, although it must be noted that [3] included all mass ratios, and r is at its maximum for an equal mass binary. Similar analyses incorporating information from unequal mass simulations, as well as simulations with spin, are currently underway. References [1] Baker, J., Van Meter, J., McWilliams, S., Centrella, J., and Kelly, B., submitted to PRL (2006), gr-qc/0612024 [2] Baker, J., McWilliams, S., Van Meter, J., Centrella, J., Kelly, B., Choi, D., and Koppitz, M., submitted to PRD (2006), gr-qc/0612117 [3] Sesana, A., Haardt, F., Madau, P., and Volonteri, M., ApJ 623 (2005) 23-30 Figure 2. r for sources at luminosity distance DL = 10 Gpc plotted vs. redshifted mass for LISA. The contributions from the early inspiral t < -1000M (dashed), the late inspiral -1000M < t < -50M (dotted), and the merger-ringdown t > -50M (thin solid), as well as their sum in quadrature (thick solid) are shown.