TDA Troubleshooting Guide: Network Traffic Analysis and Performance Checks
This guide provides step-by-step instructions for troubleshooting TDA network issues. Learn how to check concurrent connections, analyze network traffic, monitor packet loss, and assess TDA performance metrics. It includes preparation steps with recommended tools such as an SSH client and traffic analysis tools. Understand debug log settings, rule management, and how to disable known threat logging to streamline your security efforts. Access specific URLs for deeper logs and system checks to enhance TDA functionality and security.

TDA Troubleshooting Guide: Network Traffic Analysis and Performance Checks
E N D
Presentation Transcript
TDA Troubleshooting sharing Presenter NamePresenter Title
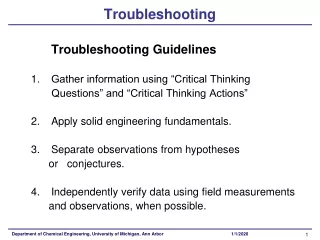
Agenda • Login Kmod page to check con-current the TDA traffic • How to check network traffic has pass-thru TDA monitor port ? • How to check packets have no lost ? • How to check TDA performance ? • How to check TDA network interface link speed? Classification
Login Kmod page to check con-current the TDA traffic • Check if packet is not dropped when mirrored to TDA • https://[TDA_Management_IP]/html/kmod_main.html • “conntrack_count” : concurrent connection including all TCP state • No packet dropped :“nr_corrupt” is 0 • No packet dropped :“ESTABLISHED” is almost equal to “conntrack_count”
Trouble Shooting • SYN_SENT: the number of TCP sessions that are in SYN_SENT state at the moment • ESTABLISHED : the number of TCP sessions that are in ESTABLISHED state at the moment • nr_corrupt : accumulated number of TCP sessions that are timed-out (60 seconds) in established state=> numbers of sessions that had packet dropped 1:syn : SYN_SENT 2:synack : SYN_RECV 3:ack : ESTABLISHED Data communication client server
What kind of tools you should ready before go to next step. • Before you go to next page, following tools you should prepared. • A SSH client, Putty is preferred. • A OpenSSH public key that support TDA access. This key that is control release by TDA R&D team. • A network traffic analysis tool like Ethereal. Classification
Debug Log • URL: https://[TDA_Management_IP]/cgi-bin/cgiSetDebugLog.cgi • It will ask you to logon TDA first to avoid non-authorized communication • Debug Level and Module Settings • Debug Level • disable,0-fatal,1-error,2-warning,3-info,4-debug • Debug Module ID • 1-cav, 3-fstream_serv, 4-mr_system_logger, 5-preconf, all • Export Debug Log • Debug Log Maintenance (Reset Debug Log) • Note • debug log will rotate when it reaches size of 10 M bytes.
Rule disable/enable • Why? • TDA provide customized rule detection for customer/analyzer • How? • URL: https://[TDA_Management_IP]/cgi-bin/cav_edit.cgi • It will ask you to logon TDA first to avoid non-authorized communication • Check Mark as Apply (TDA takes effect immediately) • Note • Rule enable/disable setting will be overwritten after update Network Content Correlation Pattern
Known threat logging disable • Why? • TDA can disable the log in database when it detects known threat (VSAPI, Network Virus) • Customer doesn’t want to see duplicate detection logs before the victim client is taken care of • How? • URL: https://[TDA_Management_IP]/cgi-bin/cav_log.cgi • It will ask you to logon TDA first to avoid non-authorized communication • Select VSAPI or Network Virus then save (TDA takes effect immediately)
Q&A Classification