1 / 7

Comparative Analysis of 2D Gel Images with Significant Ratios

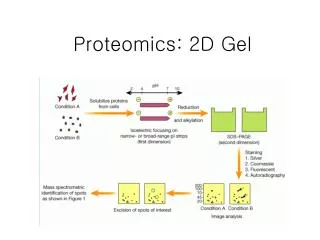
This study presents representative images of 2D gel analysis with statistical data on differentially expressed proteins. T-tests reveal significant differences and ratios in protein expression levels.

Télécharger la présentation

Comparative Analysis of 2D Gel Images with Significant Ratios

An Image/Link below is provided (as is) to download presentation Download Policy: Content on the Website is provided to you AS IS for your information and personal use and may not be sold / licensed / shared on other websites without getting consent from its author. Content is provided to you AS IS for your information and personal use only. Download presentation by click this link. While downloading, if for some reason you are not able to download a presentation, the publisher may have deleted the file from their server. During download, if you can't get a presentation, the file might be deleted by the publisher.

E N D

Presentation Transcript


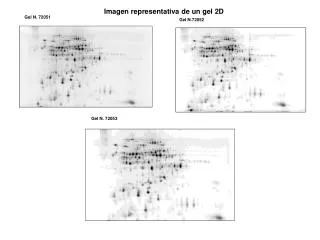
  1. Imagen representativa de un gel 2D Gel N. 72051 Gel N.72052 Gel N. 72053

  2. Imagen representativa de un gel 2D 362 372 493 495 500 492 489 1619 857 858 926

  3. T-test 2.10E-05 Ratio -1.73 493 T-test 7.70E-06 Ratio -1.73 492

  4. 858 T-test 1.40e-06 Ratio -2.82 857 T-test 3.30e-06 Ratio -2.93

  5. 500 T-test 5.20E-05 Ratio -1.8 T-test 0.00062 Ratio -1.79 372

  6. 489 T-test 9.80E-06 Ratio -1.77 495 T-test 1.60E-05 Ratio -1.77

  7. 362 T-test 0.00014 Ratio -1.69 926 T-test 0.0089 Ratio -1.73

More Related