Download
1 / 29
290 likes | 379 Vues
Explore the effects of ER niacin and laropiprant on 25,673 patients with cardiovascular disease in an independent trial. Results analysis on adverse events, glucose-related issues, musculoskeletal effects, and infection and bleeding risks.

E N D
HPS2-THRIVE: Randomized placebo-controlled trial of ER niacin and laropiprant in 25,673 patients with pre-existing cardiovascular disease. Financial Disclosure: Grant to Oxford University. Designed, conducted and analysed independently of the grant source (Merck & Co). No honoraria or consultancy fees accepted. Jane Armitage on behalf of the HPS2-THRIVE Collaborative Group
HPS2-THRIVE: Eligibility Men and women Aged 50-80 years Prior history of: myocardial infarction; ischaemic stroke or TIA; peripheral arterial disease; or diabetes with other CHD No contra-indication to study treatments No significant liver, kidney or muscle disease
HPS2-THRIVE: Active pre-randomization run-in High cardiovascular risk patients screened in 245 sites within 6 countries Screened (51,698) Standardise background LDL-lowering therapy with simvastatin 40 mg (+/- ezetimibe) daily (to total cholesterol target of 135 mg/dL) LDL lowering phase (36,059) Active ER niacin plus laropiprant (38,369) Test compliance with ER niacin 2 grams plus laropiprant 40 mg (ERN/LRPT) daily for 1 month ER niacin 2g plus laropiprant 40 mg daily vs. matching placebo tablets Randomization (25,673)
Baseline LIPIDS on statin-based therapy *64% fasted for >8 hours
Reasons for stopping study treatment 78% average compliance with active ERN/LRPT
Effect of ERN/LRPT on SERIOUS adverse events (median follow-up 3.9 years) Excess p value 3.7% <0.0001 1.8% <0.0001 1.4% <0.0001 1.0% <0.0001 0.7% 0.0008 ERN/LRPT 0.4% 0.05 0.7% 0.0002 0.3% 0.0026 Percentage of patients
Effect of ERN/LRPT on glucose related SAEs Serious adverse event ERN/LRPT Placebo Risk ratio (95% CI) Participants with diabetes at randomization (n= 8299) Minor hyperglycaemic problem 8.7% 5.8% 1.55 (1.32-1.82) Major hyperglycaemic problem 1.0% 0.3% 3.09 (1.81-5.27) Hypoglycaemia 1.1% 0.7% 1.50 (0.96-2.35) Other diabetic complication 1.1% 1.2% 0.93 (0.62-1.40) Any diabetic complication 460 311 1.55 (1.34-1.78) (11.1%) (7.5%) Participants without diabetes at randomization (n= 17,374) New-onset diabetes mellitus 792 632 1.27 (1.14-1.41) (9.1%) (7.3%)
Effect of ERN/LRPT on GI, muscle and skin SAEs Serious Adverse Event ERN/LRPT Placebo Risk ratio (95% CI) (12,838) (12,835) Gastrointestinal GI bleeding 0.8% 0.6% 1.53 (1.14-2.05) Peptic ulcer/upper GI 1.9% 1.4% 1.37 (1.13-1.65) Lower GI 0.9% 0.7% 1.39 (1.06-1.83) Other GI 1.0% 1.0% 0.99 (0.77-1.27) Any gastrointestinal SAE 620 491 1.28 (1.13-1.44) (4.8%) (3.8%) Musculoskeletal Myopathy 0.6% 0.1% 4.43 (2.62-7.50) Gout 0.3% 0.2% 1.91 (1.16-3.15) Other 2.9% 2.7% 1.08 (0.93-1.25) Any musculoskeletal SAE 481 385 1.26 (1.10-1.44) (3.7%) (3.0%) Skin Rash 0.4% 0.3% 1.63 (1.07-2.48) Ulcer 0.2% 0.1% 1.61 (0.82-3.14) Other 0.1% 0.0% 2.59 (1.05-6.37) Any skin SAE 86 51 1.67 (1.20-2.34) (0.7%) (0.4%)
Effect of ERN/LRPT on infection and bleeding Serious Adverse Event ERN/LRPT Placebo Risk ratio (95% CI) (12,838) (12,835) Infection Lower respiratory 4.3% 3.7% 1.17 (1.03-1.32) Urinary tract 0.9% 0.8% 1.07 (0.82-1.39) Abdominal/gastrointestinal 0.6% 0.5% 1.26 (0.91-1.75) Skin 0.5% 0.3% 1.66 (1.14-2.43) Other 2.4% 1.7% 1.38 (1.16-1.63) 853 Any infection SAE 1031 1.22 (1.12-1.34) (6.6%) (8.0%) Bleeding Gastrointestinal 0.8% 0.6% 1.53 (1.14-2.05) Intracranial 1.1% 0.9% 1.17 (0.92-1.50) Other 0.6% 0.4% 1.66 (1.18-2.34) Any bleeding SAE 326 238 1.38 (1.17-1.62) (1.9%) (2.5%)
Prespecified efficacy outcomes Primary outcome: MAJOR VASCULAR EVENTS (MVE) Defined as the first occurrence of either: • MAJOR CORONARY EVENT = Non-fatal MI or coronary death; • STROKE = Any non-fatal or fatal stroke (including subarachnoid haemorrhage); or • REVASCULARIZATION = Coronary or non-coronary artery surgery or angioplasty (including amputation) Secondary outcomes: • Separate components of the primary outcome • MVE in patients with or without coronary heart disease, cerebrovascular disease, peripheral artery disease and diabetes • Mortality, overall and by specific causes of death
Effects of ER niacin/laropiprant on lipids “Based on previous observational studies and randomized trials, it was anticipated such lipid differences might translate into a 10-15% reduction in vascular events” Eur Heart Journal 2013
Statistical power after about 4 years Based on estimated 3200 MVEs during median follow-up of 4 years
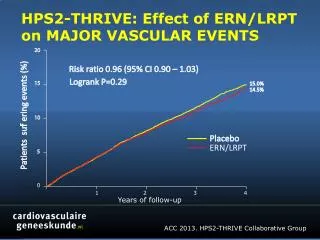
Effect of ERN/LRPT on MAJOR VASCULAR EVENTS 20 Risk ratio 0.96 (95% CI 0.90 – 1.03) LogrankP=0.29 15 15.0% 14.5% Patients suffering events (%) 10 Placebo ERN/LRPT 5 0 0 2 3 4 1 Years of follow-up
Effect of ERN/LRPT on MAJOR VASCULAR EVENTS Randomized allocation Event ERN/LRPT Placebo Risk ratio & 95% CI p (12838) (12835) Non-fatal MI 402 (3.1%) 431 (3.4%) 0.93 (0.82-1.07) 0.33 Coronary death 302 (2.4%) 291 (2.3%) 1.04 (0.89-1.22) 0.63 Major coronary event 668 (5.2%) 694 (5.4%) 0.96 (0.87-1.07) 0.51 Ischaemic stroke 389 (3.0%) 415 (3.2%) 0.94 (0.82-1.08) 0.37 Haemorrhagic stroke 114 (0.9%) 89 (0.7%) 1.28 (0.97-1.69) 0.08 Any stroke 498 (3.9%) 499 (3.9%) 1.00 (0.88-1.13) 0.56 Coronary revasc 591 (4.6%) 664 (5.2%) 0.89 (0.80-0.99) 0.04 Non-coronary revasc 236 (1.8%) 258 (2.0%) 0.92 (0.77-1.09) 0.33 Any revascularization 807 (6.3%) 897 (7.0%) 0.90 (0.82-0.99) 0.03 Major vascular event 1696 (13.2%) 1758 (13.7%) 0.96 (0.90-1.03) 0.29 0.8 1.0 1.2 ERN/LRPT better Placebo better
MVE by age, sex, region and statin-based therapy Risk ratio & 95% CI Randomized allocation Het or trend χ² ERN/LRPT Placebo (uncorrected p value) (12,838) (12,835) Age (years) < 65 740 (11.4%) 786 (12.2%) 0.00 (p=0.98) ≥ 65 <70 392 (13.9%) 367 (13.1%) ≥ 70 564 (15.9%) 605 (17.0%) Sex Male 1397 (13.2%) 1485 (14.0%) 3.21 (p=0.07) Female 299 (13.4%) 273 (12.3%) Region Europe 832 (11.3%) 913 (12.4%) 3.61 (p=0.06) China 864 (15.8%) 845 (15.5%) Statin-based therapy Simvastatin 40mg 945 (14.0%) 949 (14.0%) 1.28 (p=0.26) Ezetimibe/simvastatin 751 (12.4%) 809 (13.3%) All 1696 (13.2%) 1758 (13.7%) 3.5% SE 3.3 reduction 0.8 1.0 1.2 ERN/LRPT better Placebo better
Lipid differences (mg/dL) by age, sex, regionand statin-based therapy
MAJOR VASCULAR EVENTS by prior disease Randomized allocation Het or trend χ² ERN/LRPT Placebo Risk ratio & 95% CI (uncorrected p value) (12,838) (12,835) Coronary heart disease 0.00 Yes 1361 (13.5%) 1413 (14.0%) (p=0.96) No 335 (12.1%) 345 (12.5%) Cerebrovascular disease 0.10 Yes 616 (15.2%) 656 (16.0%) (p=0.75) No 1080 (12.3%) 1102 (12.6%) Peripheral arterial disease 1.66 Yes 302 (18.6%) 332 (20.9%) (p=0.20) No 1394 (12.4%) 1426 (12.7%) Diabetes mellitus 0.00 Yes 678 (16.4%) 708 (17.0%) (p=0.98) No 1018 (11.7%) 1050 (12.1%) 3.5% SE 3.3 All 1696 (13.2%) 1758 (13.7%) reduction 0.8 1.0 1.2 ERN/LRPT better Placebo better
MAJOR VASCULAR EVENTS by baseline lipids Randomized allocation Het or trend Χ² ERN/LRPT Placebo Risk ratio & 95% CI (uncorrected p value) mg/dL (mmol/L) (12838) (12835) HDL cholesterol <35 (0.9) 388 (15.8%) 399 (16.3%) 0.20 (p=0.66) ≥35 <43 560 (13.7%) 546 (13.5%) ≥43 (1.1) 748 (11.9%) 813 (12.8%) LDL cholesterol <58 (1.5) 724 (14.7%) 679 (13.8%) 5.91 (p=0.02) ≥58 <77 685 (12.4%) 761 (13.7%) ≥77 (2.0) 287 (12.0%) 318 (13.5%) Triglycerides <89 (1.0) 541 (13.2%) 563 (13.4%) 0.66 (p=0.42) ≥89 <151 694 (12.8%) 712 (13.2%) ≥151 (1.7) 461 (13.9%) 483 (14.8%) All 1696 (13.2%) 1758 (13.7%) 3.5% SE 3.3 reduction 0.8 1.0 1.2 ERN/LRPT better Placebo better
Effect of ERN/LRPT on CAUSE-SPECIFIC MORTALITY Randomized allocation ERN/LRPT Placebo Risk ratio & 95% CI p (12838) (12835) Coronary 302 (2.4%) 291 (2.3%) Other cardiac 15 (0.1%) 15 (0.1%) Stroke 88 (0.7%) 70 (0.5%) Other vascular 43 (0.3%) 35 (0.3%) Vascular 448 (3.5%) 411 (3.2%) 1.09 (0.96-1.25) 0.19 Neoplastic 206 (1.6%) 206 (1.6%) Hepatic 3 (0.0%) 0 (0.0%) Other medical 106 (0.8%) 92 (0.7%) Non-medical 16 (0.1%) 12 (0.1%) Unknown 19 (0.1%) 11 (0.1%) Non-vascular 350 (2.7%) 321 (2.5%) 1.09 (0.94-1.27) 0.25 Any cause 798 (6.2%) 732 (5.7%) 1.09 (0.99-1.21) 0.08 0.8 1.0 1.2 ERN/LRPT better Placebo better
HPS2-THRIVE: Summary • Significant excesses of serious adverse events (SAEs) due to known and unrecognised side-effects of niacin. Over 4 years, ER niacin/laropiprant caused SAEs in ~30 patients per 1000 • No significant benefit of ER niacin/laropiprant on the primary outcome of major vascular events when added to effective statin-based LDL-lowering therapy • No clear evidence of differences in efficacy or safety in different types of patient (except for an excess of statin-related myopathyin Chinese patients) • Findings are consistent with previous niacin trials. The role of ER niacin for the treatment and prevention of cardiovascular disease needs to be reconsidered
European Medicine Agency announcesreview of niacin based on HPS2-THRIVE “....assess the impact of the new data on the benefit-risk balance of these medicines, and will issue an opinion on whether the marketing authorisation should be maintained, varied, suspended or withdrawn across the EU.” March 2013
Effect of ERN/LRPT on SITE SPECIFIC CANCER INCIDENCE Randomized allocation ERN/LRPT Placebo Risk ratio & 95% CI p (n=12838) (n=12835) Gastrointestinal 113 (0.9%) 132 (1.0%) Respiratory 140 (1.1%) 126 (1.0%) Breast (females only) 27 (1.2%) 21 (0.9%) Melanoma 23 (0.2%) 24 (0.2%) Genitourinary 208 (1.6%) 203 (1.6%) Haematological 40 (0.3%) 33 (0.3%) Other/non-specified 88 (0.7%) 86 (0.7%) Any cancer* 622 (4.8%) 609 (4.7%) 1.02 (0.92-1.15) 0.67 Non-melanoma skin 128 (1.0%) 136 (1.1%) Recurrence of pre-rand cancer 5 (0.0%) 7 (0.1%) 0.8 1.0 1.2 ERN/LRPT better Placebo better * Excluding non-melanoma skin cancer.
MAJOR VASCULAR EVENTS by low HDL/high triglycerides and prior statin use Randomized allocation Het or trend χ² (uncorrected p value) ERN/LRPT Placebo Risk ratio & 95% CI (12838) (12835) Low HDL-C, high triglycerides Yes 333 (15.1%) 334 (15.5%) 0.00 (p=0.95) No 1363 (12.8%) 1424 (13.3%) Prior statin use (years) None 522 (16.9%) 520 (16.8%) 2.88 (p=0.09) >0 <3 478 (11.7%) 467 (11.5%) ≥3 <6 291 (10.9%) 316 (11.8%) ≥ 6 405 (13.5%) 455 (15.2%) All 1696 (13.2%) 1758 (13.7%) 3.5% SE 3.3 reduction 0.8 1.0 1.2 ERN/LRPT better Placebo better
MAJOR VASCULAR EVENTS by baseline lipids ERN/LRPT Placebo Het or trend χ² Risk ratio & 95% CI (12,838) (12,835) (uncorrected p value) HDL cholesterol (mmol/L) <0.9 388 (15.8%) 399 (16.3%) 0.20 (p=0.66) ≥ 0.9 <1.1 560 (13.7%) 546 (13.5%) ≥ 1.1 748 (11.9%) 813 (12.8%) LDL cholesterol (mmol/L) <1.5 724 (14.7%) 679 (13.8%) 5.91 (p=0.02) ≥1.5 <2.0 685 (12.4%) 761 (13.7%) ≥ 2.0 287 (12.0%) 318 (13.5%) HDL-C change during run-in (mmol/L) <0.09 528 (13.0%) 592 (14.7%) 3.58 (p=0.06) ≥ 0.09 <0.24 574 (13.3%) 565 (13.3%) ≥ 0.24 594 (13.3%) 601 (13.2%) LDL-C change during run-in (mmol/L) <0.25 587 (14.0%) 609 (14.2%) 0.03 (p=0.86) ≥ 0.25 <0.53 564 (12.7%) 597 (13.4%) ≥ 0.53 545 (12.9%) 552 (13.4%) All 1696 (13.2%) 1758 (13.7%) 3.5% SE 3.3 reduction 0.8 1.0 1.2 ERN/LRPT better Placebo better