Understanding Probability: A Comprehensive Guide by Dr. J. Frost
Dive deep into the world of probability with Dr. J. Frost’s informative slides designed for students preparing for senior mathematics challenges, university interviews, and competitions like the British Maths Olympiad. This guide covers essential topics including manipulating probabilities, random variables, and common distributions. Each section is crafted with interactive elements for an engaging learning experience, ensuring a solid foundation in probabilistic concepts with an emphasis on applications in university-level assessments.

Understanding Probability: A Comprehensive Guide by Dr. J. Frost
E N D
Presentation Transcript
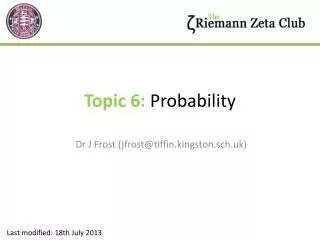
Topic 6: Probability Dr J Frost (jfrost@tiffin.kingston.sch.uk) Last modified: 18th July 2013
Slide guidance Key to question types: SMC Senior Maths Challenge Uni University Interview Questions used in university interviews (possibly Oxbridge). www.ukmt.org.uk The level, 1 being the easiest, 5 the hardest, will be indicated. Frost A Frosty Special BMO British Maths Olympiad Questions from the deep dark recesses of my head. Those with high scores in the SMC qualify for the BMO Round 1. The top hundred students from this go through to BMO Round 2. Questions in these slides will have their round indicated. Classic Classic Well known problems in maths. STEP STEP Exam MAT Maths Aptitude Test Exam used as a condition for offers to universities such as Cambridge and Bath. Admissions test for those applying for Maths and/or Computer Science at Oxford University.
Slide guidance Any box with a ? can be clicked to reveal the answer (this works particularly well with interactive whiteboards!). Make sure you’re viewing the slides in slideshow mode. ? For multiple choice questions (e.g. SMC), click your choice to reveal the answer (try below!) Question: The capital of Spain is: A: London B: Paris C: Madrid
Part 1 – Manipulating Probabilities Topic 6: Probability Part 2 – Random Variables Random Variables Discrete and Continuous Distributions Mean and Expected Value Uniform Distributions Standard Deviation and Variance Part 3 – Common Distributions Binomial Bernoulli Poisson Geometric Normal/Gaussian
Some starting notes Only some of those reading this will have done a Statistics module at A Level. Thereforeonly GCSE knowledge is assumed. There is some overlap with the field of Combinatorics. For probability problems relating to ‘arrangements’ of things, look there instead. Probability and Stats questions in… In SMC In STEP In university interviews… Harder probability questions are quite rare (although one appeared towards the end of 2012’s paper) Two questions at the end of every paper. You could avoid these, but you broaden your choice if you prepare for these. Probability questions frequently come up (although not technically requiring any more than GCSE theory). In my experience, applicants tend to do particularly bad at these questions. In BMO Used to be moderately common, but less so nowadays But some basic probability/statistics will broaden your maths ‘general knowledge’. You’ll know for example what scientists at CERN mean when they refer in the news to the “ test” needed to verify that a new particle has been discovered!
ζ Topic 6 – Probability Part 1: Manipulating Probabilities
Events and Sets An event is a set of outcomes. “Even number thrown on a die” ? Given that events can be represented as sets, we can use set operations. Suppose , say the event of throwing an even number, and , say the event of throwing a prime number. Then: means set intersection. It gives the items which are members of both sets. It represents “numbers that are even AND prime”. ? means set union. It gives the items which are members of either. It represents “numbers that are even OR prime”. ?
GCSE Recap When and are mutually exclusive(i.e. and can’t happen at the same time, or more formally , where is the ‘empty set’)… ? When and are independent(i.e. and don’t influence each other)… ? When and are mutually exclusive… ?
More useful identities When and are not mutually exclusive… ? When and are independent and mutually exclusive… ?
Conditional probabilities We might want to express the probability of an event given that another occurred: The probability that A occurred given B occurred. To appreciate conditional probabilities, consider a probability tree: 1st pick 2nd pick Red This represents the probability that a green counter was picked second GIVEN that a red counter was picked first. Red Green Green
Conditional probabilities Using the tree, we can construct the following identity for condition probabilities: B A or
Conditional probabilities If and are independent, then what is ? The Common Sense Method The Formal Method ? ? If and are independent, then the probability of occurring is not affected by whether occurred, so: Because and are independent.
Examples The events A and B are independent with and . Find: (Source: Edexcel) ? ? because and are independent. So ?
Bayes’ Rule Bayes’ Rule relates causes and effects. It allows us find the probability of the cause given the effect, if we know the probability of the effect given the cause. Dr House is trying to find the cause of a disease. He suspects Lupus (as he always does) due to their kidney failure. The probability that someone has this symptom if they did have Lupus is 0.2. The probability that a random patient has kidney damage is 0.001, and the probability they have Lupus 0.0001. What is the probability they have Lupus given their observed symptom? ?
Bayes’ Rule But we don’t always need to know the probability of the effect. Notice that in the distribution , is fixed, and the distribution is over different causes, where . This suggests we can write: where is a normalising constant that is set to ensure our probabilities add up to 1, i.e. Question: The probability that a game is called off if it’s raining is 0.7. The probability it’s called off if it didn’t rain (e.g. due to player illness) is 0.05. The probability that it rains on any given day is 0.2. Andy Murray’s game is called off. What’s the probability that rain was the cause?
Bayes’ Rule Question: The probability that a game is called off if it’s raining is 0.7. The probability it’s called off if it didn’t rain (e.g. due to player illness) is 0.05. The probability that it rains on any given day is 0.2. Andy Murray’s game is called off. What’s the probability that rain was the cause? Write down information: So Then using Bayes’ Rule: But . So , so . Then ? ?
ζ Topic 6 – Probability Part 2: Random Variables
Random Variables A random variable is a variable which can have multiple values, each with an associated probability. The variable can be thought of as a ‘trial’ or ‘experiment’, representing something which can have a number of outcomes. A random variable has 3 things associated with it: The values the random variable can have (e.g. outcomes of the throw of a die) 1 The outcomes (formally known as the ‘support vector’) 2 A probability function The probability associated with each outcome. 3 Parameters These are constants used in our probability function that can be set (e.g. number of throws)
Example random variables This symbol means “for all” Random variable (X) Outcomes Parameters? Probability Function ? ? ? {1, 2, 3, 4, 5, 6} The single throw of a fair die. None ? ? ? The single throw of an unfair die. {1, 2, 3, 4, 5, 6} We can set the probability of each outcome: p1, p2, …, p6 We use capital letters for random variables. For an outcome x and a random variable X, we express the probability as , meaning “the probability that the random variable X has the outcome x”. We sometimes write for short, with a lowercase p. In this example, we can use the probability associated with the particular outcome. We sometimes use to mean the ith outcome. Parameters are values we can control, but do not change across different outcomes. We’ll see plenty more examples.
Sketching the probability function Probabilities It’s often helpful to show the probability function as a graph. Suppose a random variable X represents the single throw of a biased die: P(X) 1 2 3 4 5 6 X Outcomes
Discrete vs Continuous Distributions Discrete distributions are ones where the outcomes are discrete, e.g. throw of a die, number of Heads seen in 10 throws, etc. In contrast continuous distributions allow us to model things like height, weight, etc. Here’s two possible probability functions: Continuous Discrete 0.4 0.3 0.2 0.1 P(X=k) P(X=h) 1.2m 1.4m 1.6m 1.8m 2.0m 2.2m 2.4m 1 2 3 4 Height of randomly picked person (h) Number of times target hit (k)
Discrete vs Continuous Distributions Discrete 0.4 0.3 0.2 0.1 Probabilities add up to 1. i.e. P(X=k) All probabilities must be between 0 and 1, i.e. . We call the probability function the: Probability massfunction (PMF for short) 1 2 3 4 Number of times target hit (k) Because our probability function is ultimately just a plain old function (provided it meets the above properties), we often see the function written as “” rather than .
Continuous Distributions ? Does it make sense to talk about the probability of someone being exactly 2m? i.e. We find the area under the graph. Note that the area under the entire graph will be 1: Clearly not, but we could for example find the probability of a height being in a particular range. P(X=h) 1.0m 1.2m 1.4m 1.6m 1.8m 2.0m 2.2m 2.4m 2.6m Height of randomly picked person (h) The probability associated with a particular value is known as the probability density. It’s value alone is not particular meaningful (and can be greater than 1!), but finding the area in a range gives us a probability mass. This is similar to histograms, where the y-axis is the ‘frequency density’, and finding the area under the bars gives us the frequency.
Probability Density Question: Archers fire arrows at a target. The probability of the arrow being a certain distance from the centre of the target is proportional to this distance. No archer is terrible enough that his arrow will be more than 1m from the centre. What’s the probability that an arrow is less than 0.5m from the centre? Source: Frosty Special ? Answer: Probability is proportional to distance. 2 Maximum distance is 1m. Since area under graph must be 1, then maximum probability density must be 2, so that the area of triangle is ½ x 2 x 1 = 1. P(X=x) We’re finding the probability of the arrow being between 0m and 0.5m, so find the area under the graph in this region. We can see this will be 0.25. 0.5 1 Distance of arrow from centre (x)
Probability Density Question: Archers fire arrows at a target. The probability of the arrow being a certain distance from the centre of the target is proportional to this distance. No archer is terrible enough that his arrow will be more than 1m from the centre. What’s the probability that an arrow is less than 0.5m from the centre? Source: Frosty Special Alternatively, using a cleaner integration approach: Step 1: Use the information to express the proportionality relationship: ? , so . Step 2: Determine constant by using the fact that ? So and thus Step 3: Finally, integrate desired range. ?
Mean and Expected Value Mean of a Sample Mean of a Random Variable But what about the mean of a random variable X? This is known as the “expected value of X”, written E[X]. It can be calculated using: or depending on whether your variable is discrete or continuous. The process of using a random variable to give us some values is known as sampling. For example, we might have measured the heights of a sample of people: The mean of a sample you’ve known how to do since primary school: Archery scores: 57, 94, 25, 42 X is “times target hit out of 3 shots”. ? ?
Expected Value Question: Two people randomly think of a real number between 0 and 100. What is the expected difference between their numbers? (i.e. the average range) (Source: Frosty Special) (Hint: Make your random variable the difference between the two numbers ) As with many problems, it’s easier to consider a simpler scenario. Consider just say integers between 0 and 10. How many ways can the numbers be chosen if the range is 0? Or the range is 1? Or 2? What do you notice? Step 1: Use the information to express the proportionality relationship: We can consider the two numbers (with range ), as a ‘window’ which we can ‘slide’ in the 0 to 100 region. The bigger the window, the less we can slide it. If they were to choose 0 and 100, we can’t slide at all. ? Step 2: Determine constant by using the fact that ? Integrating we get . If the limits are 0 and 100, we get , so
Expected Value Question: Two people randomly think of a real number between 0 and 100. What is the expected difference between their numbers? (i.e. the average range) (Source: Frosty Special) (Hint: Make your random variable the difference between the two numbers ) Step 3: Finally, given our known PDF, find E[X] ? One of the harder problem sheet exercises is to consider what happens when we introduce a 3rd number!
Modifying Random Variables We often modify the value of random variables. Example: X = outcome of a single throw of a die, Y = outcome of another die Consider X + 1 ? We add 1 to all the outcomes of the die (i.e. we now have 2 to 7) The probabilities remain unaffected. What does it mean? ? How does the expected value change? Clearly the mean value will also increase by one. i.e.: In general: ?
Modifying Random Variables We often modify the value of random variables. Example: X = outcome of a single throw of a die, Y = outcome of another die Now consider X + Y We consider all possible outcomes of X and Y, and combine them by adding them. The new set of outcomes is 2 to 12. Clearly we need to recalculate the probabilities. ? What does it mean?
Uniform Distribution A uniform distribution is one where all outcomes are equally likely. Discrete Example Continuous Example You’re generating a random triangle. You pick an angle in the range to use to construct your triangle, chosen from a uniform distribution. What is the probability (density) of picking a particular angle? This ensures the area under your PDF graph (a rectangle with width and height ) is 1. You throw a fair die. What’s the probability of each outcome? (This ensures the probabilities add up to 1). ? ?
Standard Deviation and Variance Standard Deviation gives a measure of ‘spread’. It can roughly be thought of as the average distance of values from the mean. It’s often represented by the letter . The variance is the standard deviation squared. i.e. Variance of a Sample Variance of a Random Variable This is very similar to the sample variation. We’re finding the average of the squared displacement from the mean, i.e.: Using the fact that : i.e. We can find the “mean of the squares minus the square of the mean”. We find the average of the squares of the displacements from the mean. Example: 1cm 4cm 7cm 12cm Mean = 6 Displacements are -5, -2, 1, 6 So variance is: The expected value of a value is just the value itself. Since
Standard Deviation and Variance Example: Find the variance of this biased spinner (which just has the values 1 and 2), represented by the random variable X. ? So
STEP Question Fire extinguishers may become faulty at any time after manufacture and are tested annually on the anniversary of manufacture. The time T years after manufacture until a fire extinguisher becomes faulty is modelled by the continuous probability density function: A faulty fire extinguisher will fail an annual test with probability p, in which case it is destroyed immediately. A non-faulty fire extinguisher will always pass the test. All of the annual tests are independent. a) Show that the probability that a randomly chosen fire extinguisher will be destroyed exactly three years after its manufacture is b) Find the probability that a randomly chosen fire extinguisher that was destroyed exactly three years after its manufacture was faulty 18 months after its manufacture. (We’ll do part (b) a bit later) “I have a PDF. This requires me to use definite integration.” What might be going through your head: “I need to consider each of the 3 cases.”
STEP Question Since we have a PDF, it makes sense to integrate it so we can find the probability of the extinguisher failing between some range of times. The probability the extinguisher fails sometime in the first year is , during the second year and during the third year Let’s consider the three cases: If it fails during the first year, it must survive the first two tests, before failing the third. This gives a probability of If it fails during the second year, it must survive the second test and fail on the third, giving (note that on the first test, the probability of it surviving given it’s not faulty is 1) If it fails during the third year, then it fails during the third year. We get . Adding these probabilities together gives us the desired probability.
Mean and Variance of Random Variables A point P is chosen (with uniform distribution) on the circle . The random variable denotes the distance of from . Find the mean and variance of X. [Source: STEP1 1987] An important first question is how we could chosen a random point on the circle with uniform distribution. Question: Could we for example choose the x coordinate randomly between -1 and 1, and use to determine ? Click to choose points uniformly across x. No: We can see that because the lines are steeper either side of the circle, we’d likely have less points in these regions, and thus we haven’t chosen a point with uniform distribution around the circle. We’d have a similar problem if we were trying to pick a random point on a sphere, and picked a random latitude/longitude coordinate (we’d favour the poles)
Mean and Variance of Random Variables A point P is chosen (with uniform distribution) on the circle . The random variable denotes the distance of from . Find the mean and variance of X. [Source: STEP1 1987] In which case, how can we make sure we pick a point randomly? Introduce a parameter for the angle anticlockwise from the x-axis say. Clearly this doesn’t give bias to certain regions of the arc (satisfying the ‘uniform distribution’ bit). ? So what is the distance X? (It’s an isosceles triangle, so split into 2) ? So what is E[X]? ?
Summary • Random variables have a number of possible outcomes, each with an associated probability. • Random variables can be discrete or continuous. • Discrete random variables have an associated probability mass function. We require that across the domain of the function (i.e. possible outcomes). • Continuous random variables have an associated probability density function. Unlike ‘conventional’ probabilities, these can have a value greater than 1. We require that , i.e. the total area under the graph is 1.We can find a probability mass (i.e. the ‘conventional’ kind of probability) by finding the area under the graph in a particular range, using definite integration. • While we have a ‘mean’ for a sample, we have an ‘expected value’ for a random variable, written . It can be calculated using for a discrete random variable, and for a continuous random variable. The expected value for a fair die for example is 3.5. • The variance gives a measure of spread. For specifically it’s the average squared distance from the mean. We can calculate it using , which can be remembered using the mnemonic “mean of the square minus the square of the mean”, or “msmsm”. • . i.e. Scaling our outcomes/adding has the same effect on the mean.
ζ Topic 6 – Probability Part 3: Common Distributions
Common Distributions We’ve seen so far that can build whatever random variable we like using two essential ingredients: specifying the outcomes, and specifying a PMF/PDF that associates a probability with each outcome. But there’s a number of well-known distributions for which we already have the outcomes and probability function defined: we just need to set some parameters. Bernoulli Multivariate Binomial e.g. Throw of a (possible biased) coin. e.g. Throw of a (possibly biased) die. e.g. Counts the number of heads and tails in 10 throws. Multinomial Poisson Geometric e.g. Counting the number of each face in 10 throws of a die. e.g. Number of cars which pass in the next hour given a known average rate. e.g. The number of times I have to flip a coin before I see a heads. We won’t explore these. Exponential Dirichlet e.g. The possible probability distributions for the throw of a die, given I threw a die 60 times and saw 10 ones, 10 twos, 10 threes, 10 fours, 10 fives and 10 sixes. e.g. The possible time before a volcano next erupts.
Bernoulli Distribution The Bernoulli Distribution is perhaps the most simple distribution. It models an experiment with just two outcomes, often referred to as ‘success’ and ‘failure’. It might represent the single throw of a coin. (where ‘Heads’ could represent a ‘success’) Description Outcomes Parameters? Probability Function ? ? ? p, the probability of success. “Failure”/”Success”, or {0, 1} A single trial with two outcomes. A trial with just two outcomes is known as a Bernoulli Trial. A sequence of Bernoulli Trials (all independent of each other) is known as a Bernoulli Process. An example is repeatedly flipping a coin, and recording the result each time.
Binomial Distribution Suppose I flip a biased coin. Let heads be a ‘success’ and tails be a ‘failure’. Let there be a probability that I have a success in each throw. The Binomial Distribution allows us to determine the probability of a given number of successes in n (Bernoulli) trials, in this case, the number of heads in n throws. Question: If I throw a biased coin (with probability of heads p) 8 times, what is the probability I see 3 heads? H H H T T T T T ? The probability of this particular sequence is: But there’s ways in which we could see 3 heads in 8 throws. Therefore ? ?
Binomial Distribution Therefore, in general, the probability of k successes in n trials is: Description Outcomes Parameters? Probability Function ? ? ? Binomial D Number of ‘successes’ in n trials. , the probability of a single success. , the number of trials {0, 1, 2, … , n} i.e. between 0 and n successes. We can write B(n,p) to represent the Binomial Distribution, where n and p are the parameters for the number of trials and probability of a single success. If we want some random variable X to use this distribution, we can use . The means “has the distribution of”.
Frost Real-Life Example While on holiday in Hawaii, I was having lunch with a family, where an unusually high number were left-handed: 5 out of the 8 of us (including myself). I was asked what the probability of this was. (Roughly 10% of the world population is left-handed.) Suppose X is the random variable representing the number of left handed people. Then ? ? (This example points out one of the assumptions of the Binomial Distribution: that each trial is independent. But this was unlikely to be the case, since most on the table were related, and left-handedness is in part hereditary. Sometimes when we model a scenario using an ‘off-the-shelf’ distribution, we have to compromise by making simplifying assumptions.)
Summary of Distributions so far Similarly, a multivariate distribution represents a single trial with any number of outcomes. A multinomial distribution is a generalisation of the Binomial Distribution, which gives us the probability of counts when we have multiple outcomes. Generalise to n trials Bernoulli Binomial e.g. “What’s the probability of getting a Heads?” e.g. “What’s the probability of getting 3 Heads and 2 Tails?” Generalise to k outcomes Generalise to n trials Multinomial Multivariate e.g. “What’s the probability of rolling 3 sixes, 2 fours and a 1? e.g. “What’s the probability of getting a 5? (Use your combinatorics knowledge to try and work out the probability function for this!)
Poisson Distribution Cars pass you on a road at an average rate of 5 cars a minute. What’s the probability that 3 cars will pass you in the next minute? When you have a known average ‘rate’ of events occurring, we can use a Poisson Distribution to model the number of events that occur within that period. We use to represent the average rate. We can see that when the average rate is 10 (say per minute), we’re most likely to see 10 cars. But technically, we could see a million cars (even if the probability is very low!) k is the number of events (e.g. seeing a car) that occur.
Poisson Distribution Assumptions that the Poisson Distribution makes: All events occur independently (e.g. a car passing you doesn’t affect when the next car will pass you). Events occur equally likely at any of time (e.g. we’re not any more likely to see cars at the beginning of the period than at the end) Description Outcomes Parameters? Probability Function ? ? ? , the average number of events in that period. {0, 1, 2, … } up to infinity. Number of events occurring within a fixed period given an average rate. i.e. The Poisson Distribution is a DISCRETE distribution. is Euler’s Number, with the value 2.71…
Poisson Distribution Example: An active volcano erupts on average 5 times each year. It’s equally likely to erupt at any time. Q1) What’s the probability that it erupts 10 times next year? ? Q2) What’s the probability that it erupts at all next year? ? Q3) What’s the probability that it next erupts between 2 and 3 years after the current date? i.e. It erupts 0 times in the first year, 0 times in the second year, and at least once the third year. ?
Relationship to the Binomial Distribution Imagine that we segment this fixed period into a number of smaller chunks of time, in each of which an event can occur (which we’ll describe as a ‘success’), or not occur. 1 minute A car passed in this period! A car passed in this period! If we presumed that we only had at most one car passing in each of these smaller periods of time, then we could use a Binomial Distribution to model the total number of cars that pass across 1 minute, because it models the number of successes. Of course, multiple cars could actually pass within each smaller segment of time. How would we fix this?
Relationship to the Binomial Distribution We could simply use smaller chunks of time – in the limit, we have tiny slivers of time, so instantaneous that we couldn’t possibly have two cars passing at exactly the same time. 1 minute ? Now if we’d divided up our time into chunks where is large, and we expect an average of cars to pass, what then is the probability of a car passing in one chunk of time? (Only Year 8 probability needed!) Therefore, as n becomes infinitely large (so our slivers of time become instantaneous moments), we can use the Binomial Distribution to represent the number of events that occur within some period: We need some fiddly maths to show this. tends to arise in maths when we have limits.