Download

1 / 1

E N D
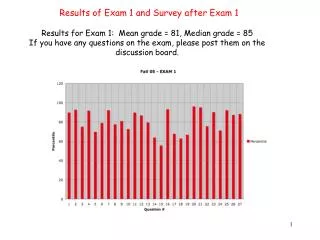
Statistical Analysis Question responses were coded on a scale of 1-5, representing the Likert Scale on the survey (Always=5, Often=4, Sometimes=3, Rarelly=2, Never=1). Initial data analysis used the ACHFPSQ Excel spreadsheet to identify the lowest-scoring foodservice categories . The survey data was statistically analyzed using paired t-tests to compare the two survey phases. Statistical significance level was set at P<0.05. IMPROVING PATIENT SATISFACTION IN A HOSPITAL FOODSERVICE SYSTEM USING LOW-COST INTERVENTIONS • Janette Smith Kudin MS, RD1; Nedra Christensen PhD, RD1; Jennifer Oler MS,RD1 ;Janet Anderson MS,RD1 ;Vanessa Theurer RD1 • Department of Nutrition, Food Science, and Dietetics, Utah State University Results Demographics: Survey Results: • Introduction Discussion • Materials and Methods • Instrument Used • Validated survey titled The Acute Care Hospital Foodservice Patient Satisfaction questionnaire (ACHFPSQ) • Population and Sample • A convenience sample of 198 inpatients served by the foodservice department during a minimum two-day stay(n=99 in each of the two rounds surveys) • Exclusions included: notable physical , cognitive, or emotional limitations and patients younger than 18 years of age • Data Collection • Hospital RDs distributed and collected surveys. • Phase#1 Response Rate: 60%. • Phase #2 Repsonse Rate: 71%. • Statistical Analysis • Initial data analysis used the ACHFPSQ Excel spreadsheet to identify the lowest-scoring foodservice categories . • Data was statistically analyzed using paired t-tests to compare the two survey phases. • Statistical significance level was set at P<0.05. Conclusion Due to the highly competitive nature of the health care industry and higher patient expectations, organizations are becoming more customer-oriented. Further investments in the conventional foodservice system likely will not achieve the goal of significant improvement in patient satisfaction. Room service system should be considered as a way to truly meet and possibly exceed the foodservice expectations of patients. Citations of Primary Resources Contact Information