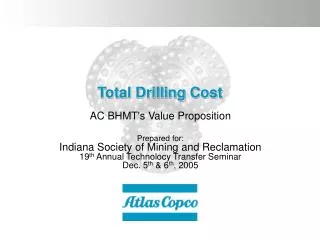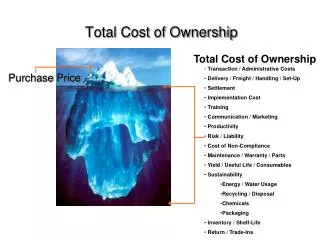
Total Cost Management
Total Cost Management. Dr. Nick J. Lavingia, P.E. Chevron Project Management Consultant APEGGA Annual Conference, Calgary April 26-27, 2007. Dr. Nick J. Lavingia, P.E. Project Management Consultant Chevron.

Total Cost Management
E N D
Presentation Transcript
Total Cost Management Dr. Nick J. Lavingia, P.E. Chevron Project Management Consultant APEGGA Annual Conference, Calgary April 26-27, 2007 Nick Lavingia
Dr. Nick J. Lavingia, P.E.Project Management ConsultantChevron Nick has over 30 years of Global Project Engineering, Management, Consulting and Training experience in the Energy industry. As a Project Management Consultant at Chevron, he provides Consultation and Training to Project Professionals worldwide. Nick has a B.S. and M.S. in Chemical & Petroleum-Refining Engineering and a Ph.D. in Engineering Economics & Management from the Colorado School of Mines. He is a registered Professional Chemical Engineer in the State of California. Nick is a member of Project Management subcommittee for Athabasca Oil Sands expansion project. He has published and presented many papers at technical organizations and is a recipient of industry award from Pathfinder for outstanding Contribution to the advancement of Project Management Technology and Chevron Chairman’s award for implementing Value Engineering throughout the corporation. Nick Lavingia
Agenda Total Cost Management: • Economic Analysis • Cost Estimating • Planning / Scheduling • Benchmarking • Contracting / Procurement • Performance Measurement • Cost Control / Forecasting • Progress Reporting • Finance / Audit Nick Lavingia
$ $ D AFE D D PFD D P&ID D EST EST Total Cost Management Phase 1 IDENTIFY & Assess Opportunities Phase 2 SELECT from Alternatives Phase 3 DEVELOP Preferred Alternative Phase 4 EXECUTE (Detail EPC) Phase 5 OPERATE & Evaluate • Economic Analysis • (NPV, ROR, Payout) • Cost Estimating • (Conceptual) • Planning/Scheduling • (Milestone) • Benchmarking • (Cost / Capacity) (Definitive) (Cost Collection / Analysis) (Funding +/- 10% Accuracy) (CPM Bar Chart) (CPM Resource Loaded) (Monitor & Update) (Pre-Funding Assessment) (Post-Project Assessment) (Set Pacesetter Target) • Contracting/Procurement • (Strategy) • Cost Control/Forecasting • (WBS) • Progress reporting • Finance/Audit (Pre-Qualification) (Award / Monitor) (Closeout) Performance Measurement (Establish Progress Payments) (Earned Value) (Establish Cost Accounts & Budgets) (Trend / Forecast) (Capital versus Expense) (Asset Accounting) Legend: AFE = Appropriation for Expenditure NPV = Net Present Value PFD = Process Flow Diagram D = Decision Point ROR = Rate of Return P&ID = Piping & Instrumentation Diagram EPC = Engineer, Procure & Construct CPM = Critical Path Method WBS = Work Breakdown Structure Nick Lavingia
Safety is an underlying value! • Safety is the foundation on which we build projects & conduct our business: • Technology selection • Facility layout • Detailed design / procurement • Construction • Commissioning & start-up • Ongoing operation • We manage safety as a fundamental part of conducting our business Cost Schedule Quality Safety Tradeoff Between Cost, Schedule & Quality Nick Lavingia
Economic Analysis Nick Lavingia
Profitability Criteria Net Present Value (NPV)…“Show Me The Money” Definition: • Sum of the Net Cash Flow discounted to time zero using a discount rate Benefits: • Incorporates time value of money ; easy to understand; recognizes magnitude of profit • Can be used for screening and ranking Disadvantages: • Independent of the size of the cash flows Nick Lavingia
Profitability Criteria Rate Of Return (ROR)…“Interest Rate” Definition: • Discount rate which equates the sum of the Net Cash Flow after tax to zero Benefits: • Incorporates time value of money • Easy to understand • Easy to compare with the cost of capital Disadvantages: • Independent of the size of the cash flows • Can be difficult to determine • Assumes reinvestment at same rate Nick Lavingia
Profitability Criteria Payout… “Time The Money Is Hanging Out There” Definition: • Time for Cumulative Net Cash Flow after tax = Investment Benefits: • Simple • Indicator of investment risk Disadvantages: • Ignores time value of money • No indication of what happens after payout Nick Lavingia
Profitability Criteria Discounted Profitability Index (DPI)…“Bang For The Buck” Definition: • DPI = 1 + (NPV of Net Cash Flow / NPV of Investment) Benefits: • Accounts for the relative size of the cash flows • Used for screening / ranking • Recognizes magnitude of profits Disadvantages: • Does not give as good an indication of sensitivity to additional investment as NPV Nick Lavingia
Cost Estimating Nick Lavingia
} • Base Estimate • + • Contingency Total Cost Estimate • Accuracy around the total What is a Cost Estimate? • Realistic representation of final project cost at any stage of project development to meet a specific project objective • Basic Components: Nick Lavingia
Quality of Estimate Nick Lavingia
Estimate Methods • Phase 1 Estimate--Cost/Capacity curves • Phase 2 Estimate--Factored estimate based on major equipment costs • Phase 3 Estimate--Detail estimate based on bids for major equipment and bulk takeoffs Nick Lavingia
Evaluate Alternative Develop Detailed Design Construction Startup Conceptual Variance Contingency Base Estimate Estimating & Contingency Determination Phase Phase Phase 1 2 3 +/- 50% +/- 25% +/-10% Estimated Cost Final Actual Cost 1.0 Nick Lavingia
Contingency C O N T Frequency I N of G E Occurrence N C Y Minimum Maximum $0.8 $1.4 $1.0Million Cost Cost (-20%) (+40%) 50/50 Value Most MEDIAN Likely Value MODE Nick Lavingia
90 % Chance that cost will not be exceeded 90/10 Equal Chance of cost exceeding or being lower 50/50 Contingency Base Allowances 90 % Chance that cost will be exceeded 10/90 Identified Scope Cost Estimate Confidence Nick Lavingia
50% 10% 90% COST 50% 10% 90% COST 50% 10% 90% COST Evolution of Estimate Accuracy • PHASE 1 • IDENTIFY • Minimal Engineering • Low definition detail • Wide accuracy • PHASE 2 • SELECT • More Engineering • More Definition • Moderate accuracy • PHASE 3 • DEVELOP (AFE) • Adequate FEL (15-30% Engineering) • Well defined • +/- 10% accuracy Nick Lavingia
Planning / Scheduling Nick Lavingia
Project Time Management - Scheduling Project Time Management includes the processes required to ensure timely completion of the project: • Activity Definition - identifying the specific activities that must be performed to produce the various project deliverables • Activity Sequencing - identifying and documenting interactivity dependencies • Activity Duration Estimating - estimating the number of work periods which will be needed • Schedule Development - analyzing activity sequences, activity duration and resource requirements to create the project schedule • Schedule Control - controlling changes to the project schedule Nick Lavingia
Schedule Level Definitions Nick Lavingia
What Is A Plan? METHODS MEANS LOGIC IDEAS A Plan Defines Activities Involved in a Project, Their Logical Sequence, and Their Inter-Relationship Nick Lavingia
Appropriated Value Contingency or Float is Added to Estimates to Reduce the Risk of Overrun. Estimates are inaccurate because they are predictions of future events and the amount of variation that will actually occur is unknown. Cost Estimate Probability Analysis 150 145 140 135 130 Cost ($millions) 125 120 115 Cost w/o contingency 110 Schedule Probability Analysis 105 28 100 0% 10% 20% 30% 40% 50% 60% 70% 80% 90% 100% 27 Appropriated Value 26 Probability 25 Schedule (months) 24 23 Base Schedule 22 21 20 0% 10% 20% 30% 40% 50% 60% 70% 80% 90% 100% Probability Nick Lavingia
Contracting / Procurement Nick Lavingia
Current Trends in Contracting & Procurement • Services • Contractor capacity is decreasing • Craft workforce shortage • Labor rates increasing • Materials & Equipment • Lead times are increasing • Prices are increasing • Inventories are decreasing • Material shortages • Marketplace • Marketplace is strong • Global mega projects • Suppliers have choices • Fabrication • Shop loading is high • Pricing is volatile Nick Lavingia
What Can Buyers Do? • Demand Planning • Plan requirements well in advance • Aggregate demand • Leverage volume • Market Intelligence • Use market data to mitigate cost increases • Monitor supply/demand • Investigate new market entrants • Commercial Considerations • Have and stick to Strategy • Tie cost increases (future decreases) to major underlying cost components • Leverage volume & spend • Lengthen term of agreement • Define work scope & manage contractors • Supplier Relationships • Exploit long term relationships • Qualify additional suppliers • Don’t let supplier know you are desperate Nick Lavingia
The Contracting Process Assess Contracting Opportunities Develop & Review Alternative Contracting Strategies Pre-qualification Bidding/Negotiating Evaluation and Agreement Execution of Contract Administration Nick Lavingia
Cost Reimbursable Guaranteed Maximum Unit Owner’s Price Fixed Cost Price Risk Owner’s Control Types of Contracts Nick Lavingia
Selection of Contracting Strategy Item Lump Sum Reimbursable Scope Definition* Market Condition Owner Participation Owner Control Owner Risk Poor Busy High Tight High Good Slow Low Minimum Low * Do not award lump sum contracts without good scope definition. Nick Lavingia
Utilities Work Facilities Process Units Offsites No. 1 No. 2 No. 3 Project Management Owner Management Support Consultants or Contractors Proprietary Technology Owner / Licensor Basic Engineering Package Detailed Engineering Procurement Reimbursable Cost Construction Management Construction Construction Contractors--Lump Sum Commissioning/Start-up Owner Preferred Contracting Strategy Nick Lavingia
Performance Measurement Nick Lavingia
Physical Progress Cost Variance Actual Hours Schedule Variance Actual Costs Productivity Cost Summary Forecasts Correct Deviations Performance Curves Schedule Status Trends Project Control Cycle - Establish Plan Project Objectives Scope Establish Plan Definition AFE Contracting Plan Estimate Control Budgets Work to Plan WBS Schedules Measure Performance Evaluate vs. Plan Nick Lavingia
EARNED HOURS PERFORMANCE = ACTUAL HOURS P E R F O R M A N C E GOOD TIME 1.0 POOR Performance Measurement Nick Lavingia
Cost and Schedule Performance Curves Budgeted SV = Scheduled Variance CV = Cost Variance DT = Time Variance } SV $ or Work Hours } CV Earned Actual DT Time Nick Lavingia
Cost Control / Forecasting Nick Lavingia
Breakdown of Estimated Costs Using the Standard Code of Accounts Do Some Work Take Corrective Action Account for Workhours Account for Costs Measure Progress Summarize Actual Costs Vs. Progress and Compare to Budget Identify Accounts With Major Variance Accumulate Cost at Project Completion Include in Historical Estimating Data Base If Appropriate Costing System to Support Cost Control Nick Lavingia
Cost Control System • COMMITMENTS • Purchase Orders and Supplements • Contracts and Change Orders • Owner Costs EXPENDITURES TRENDS BUDGETS Spreadsheet or Database • COST REPORTS • Summary • Detail TREND LOG Purchase Order Log CONTRACTS • Status Summary • Change Log Nick Lavingia
Progress Reporting Nick Lavingia
Progress Report No. 1 Nick Lavingia
Progress Report No. 2 Nick Lavingia
3000 – Budget at Completion (BAC) Date Now 2000 – Actual Cost (AC) 1600 – Planned Value (PV) 1200 – Earned Value (EV) Nick Lavingia
Progress Report No. 3 1. Cost Variance (CV) = Earned Value (EV) – Actual Cost (AC) CV = 1200 - 2000 = - 800 2. Schedule Variance (SV) = Earned Value (EV) – Planned Value (PV) SV = 1200 - 1600= - 400 3. Cost Performance Index (CPI) = Earned Value (EV) / Actual Cost (AC) CPI = 1200 / 2000 = 0.6 4. Schedule Performance Index (SPI) = Earned Value (EV) / Planned Value (PV) SPI = 1200 / 1600 = 0.75 5. Estimate To Complete (ETC) = [Budget At Completion (BAC) – Earned Value (EV)] / Cost Performance Index (CPI) ETC = (3000 - 1200) / 0.6 = 3000 6. Estimate At Completion (EAC) = Actual Cost (AC) + Estimate To Complete (ETC) EAC = 2000 + 3000 = 5000 Nick Lavingia
Summary Structured Project Development & Execution Process and Total Cost Management can help achieve World-Class Project Performance: • Better • Cheaper • Faster • Safer PROJECTS Nick Lavingia