Classical Inference ( Thresholding with Random Field Theory & False Discovery Rate methods)
620 likes | 747 Vues
This presentation by Dr. Thomas Nichols delves into advanced techniques for analyzing brain imaging data using statistical parametric maps (SPMs). It discusses the application of thresholding techniques and random field theory to improve parameter estimates and control for false discovery rates. Key topics include voxel-level and cluster-level inference, the necessity of explicit spatial modeling, challenges in high-dimensional mixture modeling, and statistical methods to assess signal detection in complex brain activity. Attendees will gain insights into optimizing sensitivity and specificity while minimizing the risk of false positives and negatives.

Classical Inference ( Thresholding with Random Field Theory & False Discovery Rate methods)
E N D
Presentation Transcript
Classical Inference (Thresholdingwith Random Field Theory &False Discovery Rate methods) Thomas Nichols, Ph.D. Assistant Professor Department of Biostatistics University of Michigan http://www.sph.umich.edu/~nichols USA SPM Course April 7, 2005
image data parameter estimates designmatrix kernel Thresholding &Random Field Theory • General Linear Model • model fitting • statistic image realignment &motioncorrection smoothing normalisation StatisticalParametric Map anatomicalreference Corrected thresholds & p-values
t > 0.5 t > 3.5 t > 5.5 Assessing Statistic Images Where’s the signal? High Threshold Med. Threshold Low Threshold Good SpecificityPoor Power(risk of false negatives) Poor Specificity(risk of false positives)Good Power • ...but why threshold?!
Blue-sky inference:What we’d like • Don’t threshold, model the signal! • Signal location? • Estimates and CI’s on(x,y,z) location • Signal magnitude? • CI’s on % change • Spatial extent? • Estimates and CI’s on activation volume • Robust to choice of cluster definition • ...but this requires an explicit spatial model space
Blue-sky inference:What we need • Need an explicit spatial model • No routine spatial modeling methods exist • High-dimensional mixture modeling problem • Activations don’t look like Gaussian blobs • Need realistic shapes, sparse representation • Some work by Hartvig et al., Penny et al.
Real-life inference:What we get • Signal location • Local maximum – no inference • Center-of-mass – no inference • Sensitive to blob-defining-threshold • Signal magnitude • Local maximum intensity – P-values (& CI’s) • Spatial extent • Cluster volume – P-value, no CI’s • Sensitive to blob-defining-threshold
Voxel-level Inference • Retain voxels above -level threshold u • Gives best spatial specificity • The null hyp. at a single voxel can be rejected u space Significant Voxels No significant Voxels
Cluster-level Inference • Two step-process • Define clusters by arbitrary threshold uclus • Retain clusters larger than -level threshold k uclus space Cluster not significant Cluster significant k k
Cluster-level Inference • Typically better sensitivity • Worse spatial specificity • The null hyp. of entire cluster is rejected • Only means that one or more of voxels in cluster active uclus space Cluster not significant Cluster significant k k
Set-level Inference • Count number of blobs c • Minimum blob size k • Worst spatial specificity • Only can reject global null hypothesis uclus space k k Here c = 1; only 1 cluster larger than k
Conjunction Inference • Consider several working memory tasks • N-Back tasks with different stimuli • Letter memory: D J P F D R A T F M R I B K • Number memory: 4 2 8 4 4 2 3 9 2 3 5 8 9 3 1 4 • Shape memory: • Interested in stimuli-generic response • What areas of the brain respond to all 3 tasks? • Don’t want areas that only respond in 1 or 2 tasks
Conjunction Inference Methods: Friston et al • Use the minimum of the K statistics • Idea: Only declare a conjunction if all of the statistics are sufficiently large • only when for all k • References • SPM99, SPM2 (before patch) • Worsley, K.J. and Friston, K.J. (2000). A test for a conjunction. Statistics and Probability Letters, 47, 135-140.
Valid Conjunction Inference With the Minimum Statistic • For valid inference, compare min stat to u • Assess minkTk image as if it were just T1 • E.g. u0.05=1.64 (or some corrected threshold) • Correct Minimum Statistic P-values • Compare minkTkto usual, univariate null distn
u Null Distribution of T t P-val Null Distribution of T Hypothesis Testing • Null Hypothesis H0 • Test statistic T • t observed realization of T • level • Acceptable false positive rate • Level = P( T>u | H0) • Threshold u controls false positive rate at level • P-value • Assessment of t assuming H0 • P( T > t | H0 ) • Prob. of obtaining stat. as largeor larger in a new experiment • P(Data|Null) not P(Null|Data)
t > 2.5 t > 4.5 t > 0.5 t > 1.5 t > 3.5 t > 5.5 t > 6.5 Multiple Comparisons Problem • Which of 100,000 voxels are sig.? • =0.05 5,000 false positive voxels • Which of (random number, say) 100 clusters significant? • =0.05 5 false positives clusters
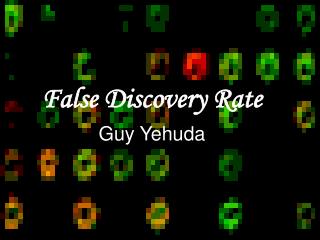
MCP Solutions:Measuring False Positives • Familywise Error Rate (FWER) • Familywise Error • Existence of one or more false positives • FWER is probability of familywise error • False Discovery Rate (FDR) • FDR = E(V/R) • R voxels declared active, V falsely so • Realized false discovery rate: V/R
MCP Solutions:Measuring False Positives • Familywise Error Rate (FWER) • Familywise Error • Existence of one or more false positives • FWER is probability of familywise error • False Discovery Rate (FDR) • FDR = E(V/R) • R voxels declared active, V falsely so • Realized false discovery rate: V/R
FWE Multiple comparisons terminology… • Family of hypotheses • Hk k = {1,…,K} • H = Hk • Familywise Type I error • weak control – omnibus test • Pr(“reject” HH) • “anything, anywhere”? • strong control – localising test • Pr(“reject” HW HW) W: W & HW • “anything, & where”? • Adjusted p–values • test level at which reject Hk
FWE MCP Solutions: Bonferroni • For a statistic image T... • Tiith voxel of statistic image T • ...use = 0/V • 0 FWER level (e.g. 0.05) • V number of voxels • u -level statistic threshold, P(Ti u) = • By Bonferroni inequality... FWER = P(FWE) = P( i {Tiu} | H0)i P( Tiu| H0 ) = i = i0 /V = 0 Conservative under correlation Independent: V tests Some dep.: ? tests Total dep.: 1 test
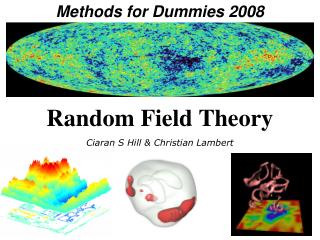
Consider statistic image as lattice representation of a continuous random field Use results from continuous random field theory SPM approach:Random fields… lattice represtntation
FWER MCP Solutions: Controlling FWER w/ Max • FWER & distribution of maximum FWER = P(FWE) = P( i {Tiu} | Ho) = P( maxiTi u | Ho) • 100(1-)%ile of max distn controls FWER FWER = P( maxiTi u | Ho) = • where u = F-1max (1-) . u
FWER MCP Solutions:Random Field Theory • Euler Characteristic u • Topological Measure • #blobs - #holes • At high thresholds,just counts blobs • FWER = P(Max voxel u | Ho) = P(One or more blobs | Ho) P(u 1 | Ho) E(u| Ho) Threshold Random Field No holes Never more than 1 blob Suprathreshold Sets
Only very upper tail approximates1-Fmax(u) RFT Details:Expected Euler Characteristic E(u) () ||1/2 (u 2 -1) exp(-u 2/2) / (2)2 • Search regionR3 • (volume • ||1/2roughness • Assumptions • Multivariate Normal • Stationary* • ACF twice differentiable at 0 • Stationary • Results valid w/out stationary • More accurate when stat. holds
FWHM Autocorrelation Function Random Field TheorySmoothness Parameterization • E(u) depends on ||1/2 • roughness matrix: • Smoothness parameterized as Full Width at Half Maximum • FWHM of Gaussian kernel needed to smooth a whitenoise random field to roughness
1 2 3 4 5 6 7 8 9 10 1 2 3 4 Random Field TheorySmoothness Parameterization • RESELS • Resolution Elements • 1 RESEL = FWHMx FWHMy FWHMz • RESEL Count R • R = () || = (4log2)3/2 () / ( FWHMx FWHMy FWHMz ) • Volume of search region in units of smoothness • Eg: 10 voxels, 2.5 FWHM 4 RESELS • Beware RESEL misinterpretation • RESEL are not “number of independent ‘things’ in the image” • See Nichols & Hayasaka, 2003, Stat. Meth. in Med. Res. .
Random Field TheorySmoothness Estimation • Smoothness est’dfrom standardizedresiduals • Variance ofgradients • Yields resels pervoxel (RPV) • RPV image • Local roughness est. • Can transform in to local smoothness est. • FWHM Img = (RPV Img)-1/D • Dimension D, e.g. D=2 or 3
Random Field Intuition • Corrected P-value for voxel value t Pc = P(max T > t) E(t) () ||1/2t2 exp(-t2/2) • Statistic value t increases • Pc decreases (but only for large t) • Search volume increases • Pc increases (more severe MCP) • Roughness increases (Smoothness decreases) • Pc increases (more severe MCP)
RFT Details:Unified Formula • General form for expected Euler characteristic • 2, F, & t fields • restricted search regions •D dimensions • E[u(W)] = SdRd(W)rd (u) Rd (W):d-dimensional Minkowski functional of W – function of dimension, spaceWand smoothness: R0(W) = (W) Euler characteristic of W R1(W) = resel diameter R2(W) = resel surface area R3(W) = resel volume rd (W):d-dimensional EC density of Z(x) – function of dimension and threshold, specific for RF type: E.g. Gaussian RF: r0(u) = 1- (u) r1(u) = (4 ln2)1/2 exp(-u2/2) / (2p) r2(u) = (4 ln2) exp(-u2/2) / (2p)3/2 r3(u) = (4 ln2)3/2 (u2 -1) exp(-u2/2) / (2p)2 r4(u) = (4 ln2)2 (u3 -3u) exp(-u2/2) / (2p)5/2
Expected Cluster Size E(S) = E(N)/E(L) S cluster size N suprathreshold volume({T > uclus}) L number of clusters E(N) = () P( T > uclus ) E(L) E(u) Assuming no holes 5mm FWHM 10mm FWHM 15mm FWHM Random Field TheoryCluster Size Tests
Random Field TheoryCluster Size Distribution • Gaussian Random Fields (Nosko, 1969) • D: Dimension of RF • t Random Fields (Cao, 1999) • B: Beta distn • U’s: 2’s • c chosen s.t.E(S) = E(N) / E(L)
Random Field TheoryCluster Size Corrected P-Values • Previous results give uncorrected P-value • Corrected P-value • Bonferroni • Correct for expected number of clusters • Corrected Pc = E(L) Puncorr • Poisson Clumping Heuristic (Adler, 1980) • Corrected Pc = 1 - exp( -E(L) Puncorr )
Lattice ImageData Continuous Random Field Random Field Theory Limitations • Sufficient smoothness • FWHM smoothness 3-4× voxel size (Z) • More like ~10× for low-df T images • Smoothness estimation • Estimate is biased when images not sufficiently smooth • Multivariate normality • Virtually impossible to check • Several layers of approximations • Stationary required for cluster size results
Active ... ... yes Baseline ... ... D UBKDA N XXXXX no Real Data • fMRI Study of Working Memory • 12 subjects, block design Marshuetz et al (2000) • Item Recognition • Active:View five letters, 2s pause, view probe letter, respond • Baseline: View XXXXX, 2s pause, view Y or N, respond • Second Level RFX • Difference image, A-B constructedfor each subject • One sample t test
Real Data:RFT Result • Threshold • S = 110,776 • 2 2 2 voxels5.1 5.8 6.9 mmFWHM • u = 9.870 • Result • 5 voxels above the threshold • 0.0063 minimumFWE-correctedp-value -log10 p-value
MCP Solutions:Measuring False Positives • Familywise Error Rate (FWER) • Familywise Error • Existence of one or more false positives • FWER is probability of familywise error • False Discovery Rate (FDR) • FDR = E(V/R) • R voxels declared active, V falsely so • Realized false discovery rate: V/R
False Discovery Rate • For any threshold, all voxels can be cross-classified: • Realized FDR rFDR = V0R/(V1R+V0R) = V0R/NR • If NR = 0, rFDR = 0 • But only can observe NR, don’t know V1R & V0R • We control the expected rFDR FDR = E(rFDR)
False Discovery RateIllustration: Noise Signal Signal+Noise
11.3% 11.3% 12.5% 10.8% 11.5% 10.0% 10.7% 11.2% 10.2% 9.5% 6.7% 10.5% 12.2% 8.7% 10.4% 14.9% 9.3% 16.2% 13.8% 14.0% Control of Per Comparison Rate at 10% Percentage of Null Pixels that are False Positives Control of Familywise Error Rate at 10% FWE Occurrence of Familywise Error Control of False Discovery Rate at 10% Percentage of Activated Pixels that are False Positives
p(i) i/V q/c(V) Benjamini & HochbergProcedure • Select desired limit q on FDR • Order p-values, p(1)p(2) ... p(V) • Let r be largest i such that • Reject all hypotheses corresponding top(1), ... , p(r). JRSS-B (1995)57:289-300 1 p(i) p-value i/V q/c(V) 0 0 1 i/V
Adaptiveness of Benjamini & Hochberg FDR Ordered p-values p(i) P-value threshold when no signal: /V P-value thresholdwhen allsignal: Fractional index i/V
Benjamini & Hochberg Procedure Details • c(V) = 1 • Positive Regression Dependency on Subsets P(X1c1, X2c2, ..., Xkck | Xi=xi) is non-decreasing in xi • Only required of test statistics for which null true • Special cases include • Independence • Multivariate Normal with all positive correlations • Same, but studentized with common std. err. • c(V) = i=1,...,V 1/i log(V)+0.5772 • Arbitrary covariance structure Benjamini &Yekutieli (2001).Ann. Stat.29:1165-1188