Download
1 / 27
300 likes | 559 Vues
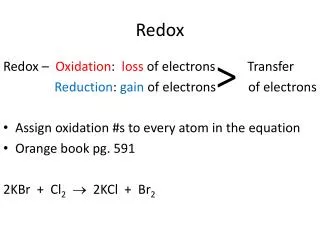
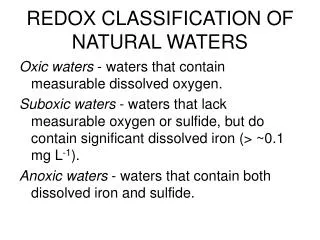
REDOX CLASSIFICATION OF NATURAL WATERS. Oxic waters - waters that contain measurable dissolved oxygen. Suboxic waters - waters that lack measurable oxygen or sulfide, but do contain significant dissolved iron (> ~0.1 mg L -1 ).

E N D
REDOX CLASSIFICATION OF NATURAL WATERS Oxicwaters - waters that contain measurable dissolved oxygen. Suboxic waters - waters that lack measurable oxygen or sulfide, but do contain significant dissolved iron (> ~0.1 mg L-1). Anoxic waters - waters that contain both dissolved iron and sulfide.
DEFINITION OF Eh Eh - the potential of a solution relative to the SHE. Both pe and Eh measure essentially the same thing. They may be converted via the relationship: Where = 96.42 kJ volt-1 eq-1 (Faraday’s constant). At 25°C, this becomes or
Eh – Measurement and meaning • Eh is the driving force for a redox reaction • No exposed live wires in natural systems (usually…) where does Eh come from? • From Nernst redox couples exist at some Eh (Fe2+/Fe3+=1, Eh = +0.77V) • When two redox species (like Fe2+ and O2) come together, they should react towards equilibrium • Total Eh of a solution is measure of that equilibrium
PROBLEMS WITH Eh MEASUREMENTS • Natural waters contain many redox couples NOT at equilibrium; it is not always clear to which couple (if any) the Eh electrode is responding. • Eh values calculated from redox couples often do not correlate with each other or directly measured Eh values. • Eh can change during sampling and measurement if caution is not exercised. • Electrode material (Pt usually used, others also used) • Many species are not electroactive (do NOT react at electrode) • Many species of O, N, C, As, Se, and S are not electroactive at Pt • electrode can become poisoned by sulfide, etc.
Figure 5-6 from Kehew (2001). Plot of Eh values computed from the Nernst equation vs. field-measured Eh values.
Other methods of determining the redox state of natural systems • For some, we can directly measure the redox couple (such as Fe2+ and Fe3+) • Techniques to directly measure redox SPECIES: • Amperometry (ion specific electrodes) • Voltammetry • Chromatography • Spectrophotometry/ colorimetry • EPR, NMR • Synchrotron based XANES, EXAFS, etc.
Free Energy and Electropotential • Talked about electropotential (aka emf, Eh) driving force for e- transfer • How does this relate to driving force for any reaction defined by DGr ?? DGr = nDE or DG0r = nDE0 • Where n is the # of e-’s in the rxn, is Faraday’s constant (23.06 cal V-1), and E is electropotential (V) • pe for an electron transfer between a redox couple analagous to pK between conjugate acid-base pair
Electromotive Series • When we put two redox species together, they will react towards equilibrium, i.e., e- will move which ones move electrons from others better is the electromotive series • Measurement of this is through the electropotential for half-reactions of any redox couple (like Fe2+ and Fe3+) • Because DGr = nDE, combining two half reactions in a certain way will yield either a + or – electropotential (additive, remember to switch sign when reversing a rxn) -E - DGr, therefore spontaneous • In order of decreasing strength as a reducing agent strong reducing agents are better e- donors
Biology’s view upside down? Reaction directions for 2 different redox couples brought together?? More negative potential reductant // More positive potential oxidant Example – O2/H2O vs. Fe3+/Fe2+ O2 oxidizes Fe2+ is spontaneous!
Nernst Equation Consider the half reaction: NO3- + 10H+ + 8e- NH4+ + 3H2O(l) We can calculate the Eh if the activities of H+, NO3-, and NH4+ are known. The general Nernst equation is The Nernst equation for this reaction at 25°C is
Let’s assume that the concentrations of NO3- and NH4+ have been measured to be 10-5 M and 310-7 M, respectively, and pH = 5. What are the Eh and pe of this water? First, we must make use of the relationship For the reaction of interest rG° = 3(-237.1) + (-79.4) - (-110.8) = -679.9 kJ mol-1
The Nernst equation now becomes substituting the known concentrations (neglecting activity coefficients) and
Stability Limits of Water • H2O 2 H+ + ½ O2(g) + 2e- Using the Nernst Equation: • Must assign 1 value to plot in x-y space (PO2) • Then define a line in pH – Eh space
UPPER STABILITY LIMIT OF WATER (Eh-pH) To determine the upper limit on an Eh-pH diagram, we start with the same reaction 1/2O2(g) + 2e- + 2H+ H2O but now we employ the Nernst eq.
As for the pe-pH diagram, we assume that pO2 = 1 atm. This results in This yields a line with slope of -0.0592.
LOWER STABILITY LIMIT OF WATER (Eh-pH) Starting with H+ + e- 1/2H2(g) we write the Nernst equation We set pH2 = 1 atm. Also, Gr° = 0, so E0 = 0. Thus, we have
O2/H2O C2HO
Redox titrations • Imagine an oxic water being reduced to become an anoxic water • We can change the Eh of a solution by adding reductant or oxidant just like we can change pH by adding an acid or base • Just as pK determined which conjugate acid-base pair would buffer pH, pe determines what redox pair will buffer Eh (and thus be reduced/oxidized themselves)
Making stability diagrams • For any reaction we wish to consider, we can write a mass action equation for that reaction • We make 2-axis diagrams to represent how several reactions change with respect to 2 variables (the axes) • Common examples: Eh-pH, PO2-pH, T-[x], [x]-[y], [x]/[y]-[z], etc
Construction of these diagrams • For selected reactions: Fe2+ + 2 H2O FeOOH + e- + 3 H+ How would we describe this reaction on a 2-D diagram? What would we need to define or assume?
How about: • Fe3+ + 2 H2O FeOOH(ferrihydrite) + 3 H+ Ksp=[H+]3/[Fe3+] log K=3 pH – log[Fe3+] How would one put this on an Eh-pH diagram, could it go into any other type of diagram (what other factors affect this equilibrium description???)
Redox titrations • Imagine an oxic water being reduced to become an anoxic water • We can change the Eh of a solution by adding reductant or oxidant just like we can change pH by adding an acid or base • Just as pK determined which conjugate acid-base pair would buffer pH, pe determines what redox pair will buffer Eh (and thus be reduced/oxidized themselves)
Redox titration II • Let’s modify a bjerrum plot to reflect pe changes
Redox titrations in complex solutions • For redox couples not directly related, there is a ladder of changing activity • Couple with highest + potential reduced first, oxidized last • Thermodynamics drives this!!
O2 Aerobes Oxic H2O Dinitrofiers NO3- N2 Maganese reducers Post - oxic MnO2 Mn2+ Iron reducers Fe(OH)3 Fe2+ SO42- Sulfate reducers Sulfidic H2S CO2 Methanogens CH4 Methanic H2O H2 The Redox ladder The redox-couples are shown on each stair-step, where the most energy is gained at the top step and the least at the bottom step. (Gibb’s free energy becomes more positive going down the steps)