Download
1 / 49
500 likes | 696 Vues
Advances in Skeletal Dosimetry Through Microimaging. Wesley Bolch, PhD, PE, CHP Director, Advanced Laboratory for Radiation Dosimetry Studies Department of Nuclear & Radiological Engineering University of Florida, Gainesville, FL Oak Ridge National Laboratory Tuesday, August 2

E N D
Advances in Skeletal Dosimetry Through Microimaging Wesley Bolch, PhD, PE, CHP Director, Advanced Laboratory for Radiation Dosimetry Studies Department of Nuclear & Radiological Engineering University of Florida, Gainesville, FL Oak Ridge National Laboratory Tuesday, August 2 NCI Grant CA96441 and DOE Grant DE-FG07-02ID14327
Strategies for Cancer Therapy • External Beam Therapy(photons, protons, heavy ions) • Insertion of Radioactive Seeds(brachytherapy) • Radionuclide Therapy • Unsealed Sources • Tagged to bio-molecules (antibodies, peptides, etc.)
Radionuclide TherapyUnsealed Sources • Benign Disease • 131I sodium iodine Grave’s disease, goiter • 32P sodium phosphate Polycythemia, thrombocythemia • 90Y silicate colloid Severe arthritis • 165Dy ferric hydroxide Severe arthritis
Radionuclide TherapyUnsealed Sources • Malignant Disease • 131I sodium iodine Thyroid cancer, residual disease • 131I MIBG Metastatic neuroblastoma • 111In octreotide Neuroblastoma • 32P chronic phosphate Intracavity therapy • 89Sr strontium chloride Painful skeletal metastases • 153Sm EDTP Painful skeletal metastases • 186Re HEDP Painful skeletal metastases
Radioimmunotherapy (RIT) • Solid Tumors • 131I anti-EGFr Recurrent gliomas • 125I-425 , 131I-BC-2 Glioblastoma multiforme • 131I-HMFG1, 186Re-NRLU19 Ovarian cancer • 177Lu-CC49 Breast, colon, lung cancer • 131I-CC49 Prostate cancer • 90Y- or 131I-anti-ferritin Hepatoma • 186Re HEDP Gastrointestinal cancer • 90Y-ChT84.66 anti-CEA Colon cancer
Radioimmunotherapy (RIT) of B-Cell Lymphoma • Non-myeloablative • 131I Lym-1, LL2, Anti-B1, MB1 • 90Y B1, 2B8, C2B8 Myeloablative • 131I B1, MB1, LL2, 1F5, BC8 • 90Y B1 • 213Bi HuM-195
What maximal radionuclide administration can I deliver to the patient? Need to avoid normal organ complications Bone marrow, lungs, GI tract wall, kidneys How can I predict this maximum-tolerated activity in a given patient? Dose-response function for marrow toxicity Perform patient-specific estimates of marrow dose Fundamental Questions in RIT
MIRD Method for Calculating Internal Dose “Integrated Activity” Integral no. of decays in source region rS “S Value” Dose to target region rT per decay in source rS
Radionuclide S Values “Absorbed Fraction” Fraction of particle energy emitted in rS that is deposited in rT
Potential Sources ( rS ) Active bone marrow non-specific uptake (blood/fluid spaces) or specific antibody binding (cells) Osseous tissues of bone Uniformly distributed within the bone volumes Uniformly distributed on the interior bone surfaces Potential Targets ( rT ) Active bone marrow Stem cells and their precursors Endosteum – tissue layer on the bone surfaces Single-cell layer containing osteoblasts (bone building cells) and osteoclasts (bone destroying cells) Source and Target Regions
Bone Structure • Cancellous Bone • spongy bone • trabecular bone • Cortical Bone • hard bone • compact bone Spongiosa = trabecular bone + marrow tissues + endosteum
Hematopoietic cellular component granulocytic, erythroid, and megakaryocytic series Bone marrow stromal cells and extracellular matrix adipocytes, reticulum cells, endothelial cells Venous sinuses and other blood vessels Various support cells lymphocytes, plasma cells, mast cells, macrophages Tissues of the Bone Marrow
Marrow Cellularity Marrow Cellularity= Fraction of total marrow space occupied by hematopoietic cells(cellularity factor, CF) ≈ 1 - (Fat Fraction) bone trabecula active or red marrow inactive or yellow marrow (adipocytes) endosteum
MIRD Method for Calculating Internal Dose “Integrated Activity” Integral no. of decays in source region rS “S Value” Dose to target region rT per decay in source rS
Patient-specific estimates of (2) Inference from Blood Measurements (1) Direct NM imaging RMECFF = red marrow extracellular fluid fraction HCT = patient’s hematocrit
Out of necessity, the medical community has borrowed the ICRP reference skeletal models developed originally for radiological protection The ICRP model has two components… Reference skeletal masses from the work of Mechanic (1926) Reference absorbed fractions from the work of Spiers (early 1970s) Important Point – AF data come from an entirely different anatomic source than those used to define reference tissue masses Patient-specific estimates of S ?
6 male cadavers and 7 female cadavers (18 to 86 y) Senile marasmus (4 cases), tuberculosis (3 cases), heart disease (2 cases), and malaria (1 case) “The bodies appear to have been somewhat but not excessively, emaciated, the weights of the women ranging from 43.5 to 55.2 kg, and those of the men from 59.6 to 65.0 kg.” “It is most unfortunate that the bodies of previously healthy victims of accidents or other causes of sudden death were not chosen for study…” Study by Mechanik (1926)as summarized by Woodward (1960)
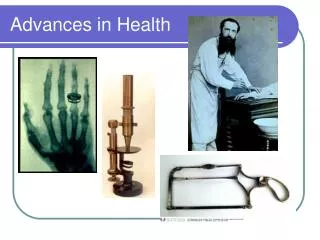
Original anatomic source for current absorbed fractions Single 44-year-old male (skeletal reference man) Contact radiographs taken Parietal bone, cervical vertebra, lumbar vertebra, rib, iliac crest, femur head, and femur neck Optical scanning system developed Chord length distributions were obtained Marrow cavities Bone trabeculae FW Spiers at the University of Leeds
Current Models of Skeletal Dosimetry • 1D models of particle transport • Only 7 skeletal sites • Single 44y male • Masses of target tissues taken for other studies
CBIST modeling approach Chord-Based Infinite Spongiosa Transport Both a and b particles are following through an infinite expanse of spongiosa (interior tissues of trabecular bone) until their full emission energy is expended No accounting for electron escape to cortical bone Applications for a and b particles
Marrow Spatial Model 70% X 4 50% 30%
Alpha-Particles – Active MarrowComparisons to ICRP 30 and OLINDA
Absorbed dose to active bone marrow Fluence-to-dose response function (DRF) Based upon CBIST electron results Mass energy absorption coefficient (MEAC) ratio CT number method Provides for a unique composition per skeletal voxel Absorbed dose to endosteum Fluence-to-dose response function (DRF) Based upon CBIST electron results Homogeneous bone dose approximation Applications for photons
3D Image-Based Skeletal Dosimetry UF Adult Male Model • Cadaver selection (66 yr, 68 kg, 173 cm, 22.7 kg m-2) • Whole-body CT imaging (~ 1 mm3 voxels) • Bone site harvesting (13 major sites of adult active bone marrow) • Ex-vivo CT imaging of each excised skeletal site • Image processing → volumes of spongiosa (1 mm x 0.3 mm2) • Spongiosa → combined tissues of trabeculae, endosteum, active and inactive marrow • Section skeletal sites – cubes of spongiosa • Microimaging of spongiosa • NMR microscopy or mCT (30 – 80 mm3) • Radiation transport simulation of electron/betas
Skeletal-Averaged Absorbed FractionsUF Model and the 2000 Eckerman Model (MIRDOSE3)
Skeletal-Averaged Absorbed FractionsUF and 2003 Eckerman Model (OLINDA)
Factors to consider… Physical stature (size of the skeleton) Decreases in physical stature will result in higher electron escape to cortical bone Bone mineral status Decreases in BMD are primarly associated with thinning and eventual loss of bone trabeculae. Loss of bone mass is usually accompanied by increases marrow fat (MVF x CF perhaps remains constant) Marrow cellularity Changes in marrow cellularity can be accounted for explicitly in the PIRT or other image-based models How can one adjust this image-based skeletal model to the individual patient?
Pelvic SPECT-CT of RIT Patient SPECT image quantify marrow / skeletal uptake in sacrum or lumbar vertebrae CT image Make skeletal size measurement (e.g., pelvic height) CT image Using a calibration curve from a previously imaged BMD phantom, assess the patient’s volumetric BMD (femoral neck, lumbar vertebrae) MR imaging or BM biopsy Assess marrow cellularity of the patient, Assume reference values or some proportional change thereof Clincial Input Data for patient-specific model adjustment
PIRT ModelAdjustments for skeletal stature From previous cadaver skeletal studies… where AP – anthropometric parameter such as total body height or head circumference IBP – image-based parameter such as pelvic height PIRT model run at size specific to the patient
PIRT ModelAdjustments for skeletal stature VBIST Results
PIRT ModelAdjustments for bone mineral status From previous cadaver skeletal studies… where BMD – volumetric CT-based bone mineral density measured at the femoral head/neck and lumbar vertebrae PIRT model run using microCT images from a reference library Normal BMDv mCT Images Osteopenic BMDv mCT Images Osteoporotic BMDv mCT Images
95% Cellularity 60% Cellularity 15% Cellularity PIRT ModelAdjustments for marrow cellularity
biopsy or MR imaging (Ballon et al. MP 1996) CT measurements in patient at a reference skeletal site (e.g., LV or sacrum) (Shen et al. JNM 2002) BMDV measurement at same skeletal site (e.g., LV or sacrum) Scalability of Image-Based ModelsImproved Patient Specificity
PIRT ModelAdjustments for location of cellular targets CD34 staining of BM biopsies