Lecture 30 Review: First Order Highpass and Lowpass Filters
This lecture reviews the concepts of first order highpass and lowpass filters, including cutoff frequency, frequency response results, and time-to-frequency domain relations. Bode plots are also discussed.


Lecture 30 Review: First Order Highpass and Lowpass Filters
E N D
Presentation Transcript
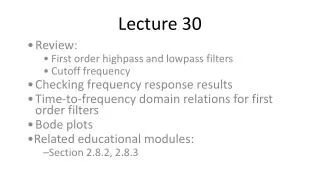
Lecture 30 Review: First order highpass and lowpass filters Cutoff frequency Checking frequency response results Time-to-frequency domain relations for first order filters Bode plots Related educational materials: Chapter 11.3, 11.4
Filters • Circuits categorized by their amplitude response • Filters “pass” some frequencies and “stop” others • Lowpass filters pass low frequencies • Highpass filters pass high frequencies • Filters are also categorized by their order • The filter order corresponds to the order of the circuit’s governing differential equation • Circuits I: only first order low- and highpass filters
First order filters • Review: Low- and highpass filter response examples • Cutoff frequency separates the pass- and stopbands • Where the amplitude response is times the max amplitude
Annotate previous slide to show cutoff frequencies • Note that cutoff frequency is related to maximum gain of filter • Change max gain on figure (write in) => gain at corner frequency changes
Time vs. frequency domain characterization • In the time domain, we characterized first order circuits by their step response • DC gain, time constant ( ) • We can likewise characterize first order circuits by their frequency response • DC gain, cutoff frequency (c)
On previous slide, sketch step response, show DC gain • Then show that cosine input becomes a step input as frequency -> zero
Time-to-Frequency domain relations – cont’d • Governing differential equation for first order system: • Converting to frequency domain:
On previous slide, show: • (1) time domain DC gain, tau • (2) conversion to frequency response => u(t)=Ue^(jwt), etc. • (3) freqency response -> magnitude response • (4) DC gain and cutoff frequency from mag. Resp.
Checking amplitude responses • We can (fairly) easily check our amplitude responses at very low and very high frequencies • Capacitors, inductors replaced by open, short circuits • Results in purely resistive network • Analyze resistive network, and compare result to amplitude response • Provides “physical insight” into low, high frequency operation
Inductors at low, high frequencies • Inductor impedance: • = 0 • Inductor behaves like short circuit at low frequencies • • Inductor behaves like open circuit at high frequencies
Capacitors at low, high frequencies • Capacitor impedance: • = 0 • Capacitor behaves like open circuit at low frequencies • • Capacitor behaves like short circuit at high frequencies
Example – checking amplitude response • What is the amplitude response of the circuit below as 0 and ?
Bode plots – introduction • We have used linear scales to plot frequency responses • Selective use of logarithmic scales has a number of advantages: • Amplitudes and frequencies tend to span large ranges • Logarithms convert multiplication and division to addition and subtraction • Human senses work logarithmically • Bode plots use logarithmic scales to simplify plotting of frequency responses and interpretation of plots
Do demos on previous slide • Note large ranges of frequencies; sensitivity to frequency ranges • Note human senses work logarithmically
Nomenclature relative to log scales • Logarithmic scales convert multiplicative factors to linear differences • Some of these multiplicative factors have special names • A factor of 10 change in frequency is a decade difference on a log scale • A factor of 2 change in frequency is an octave difference on a log scale
Bode Plots • Bode plots are a specific format for plotting frequency responses • Frequencies are on logarithmic scales • Amplitudes are on a decibel (dB) scale • Phases are on a linear scale
Decibels • Named for Alexander Graham Bell • Common gains and their decibel values: 10 20dB 1 0dB 0.1 -20dB 0.5 -6dB -3dB
Bode plots of first order filters • Frequency response for typical first order lowpass filter: • Magnitude, phase responses:
Annotate previous slide to show asymptotic behavior, -3dB point at wc, intersection of asymptotes is at wc • Note that I can muliply this by a gain, without affecting the shape of the curve – it simply moves up and down
Annotate previous slide to show asymptotic behavior, -45 degrees at wc
Example • Sketch a Bode plot for the circuit below.