Download
1 / 33
330 likes | 346 Vues
Learn about the techniques and methods used to study habitat selection and resource use in wildlife management, including the importance of scale, sampling protocols, and modeling occupancy. Understand how these studies can inform management decisions.

E N D
MODELING VERTEBRATE USE OF TERRESTRIAL RESOURCES Lyman L. McDonald, Wallace P. Erickson, Mark S. Boyce, J. Richard Alldredge
Introduction It is essential that wildlife management studies identify habitat selection (i.e., vegetation types and foods used) by animals in comparison to those resources in a study area. The availability and use of the environmental components that are necessary for life impact abundance of animals and distribution of their populations in space and time. Biologist must collect site- and time-specific information on patterns of vegetation types and food use. But how is such information obtained? What should be considered when a study is designed to identify vegetation types or food use? This chapter provides an outline of the major techniques used to study these issues and some problems likely to be encountered.
Resource Selection Definitions • Use: indicates association or consumption • Selective: if components are exploited disproportional to their availability Resource Availability: the quantity accessible to an animal • Abundance: the quantity of the resource in a study area • Preference: as selection independent of availability • Enclosure Experiments: provide habitat categories in equal abundance • Cafeteria Experiments: captive animals are presented a variety of foods and allowed to choose among them • Study Area: When choosing areas, one must consider the distribution of resource units, scale of selection studied, what is truly available to the animals, and manpower and budget constraints for collection of data. • Resource Units: indicate either habitat units, points in the habitat, or food items.
Modeling Occupancy • A primary application of the methods presented is in monitoringpopulations by estimation and mapping of the relative probability that units (grid cells, pixels, etc.) are occupied by a species “as measured by the sampling design.” • Study protocols requiring multiple independent surveys of units have been developed to obtain “patch occupancy models”, giving “clean” estimates of the probability of occupancy. • One should consider use of more expensive and time-consuming survey methods when faced with monitoring species distribution where probability of detection varies significantly among vegetation types.
Levels of Selection and Effects of Scale • Habitat selection can occur at a variety of levels or scales with animals selecting habitats according to a hierarchical scheme. These scales include the biogeographic (e.g., the eastern deciduous forest), home range, activity points, such as a den, nest, or roost site within a home range, and selection of particular foods at an activity point. Factors that influence selection at each of these scales also vary. For example, climatic extremes may affect the geographic range of a species, whereas vegetation structure may influence home range size and shape, and competition with conspecifics or predation risk may influence territory placement within a home range. The distribution of food and cover is probably most influential in affecting local movements within a home range. • The choice of an appropriate spatial and temporal scale of measurement, and consideration of spatial pattern will directly influence results and their interpretation
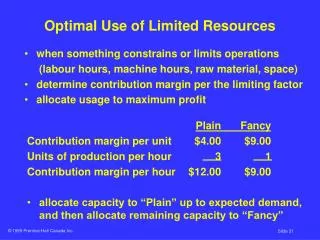
Management Implications of Resource Selection • The limits of data should be recognized when applications of research conclusions to manipulations of habitats or populations are considered. Analyses can be helpful in identifying patterns of habitat or food selection. However, biologists should not necessarily conclude biological need from such patterns. Although selection may have been demonstrated, one has not shown how fitness (e.g., survival or reproductive success) of an animal varies with different amounts of the selected habitat. We cannot make a "biological leap of faith'' One cannot assume that if one increases the amount of the selected habitat (or food), one will have more animals. • Therefore, if the objective is to evaluate the biological importance of a particular habitat, one should consider some type of manipulation experiment in which the amounts of the selected habitat (or food) are varied and fitness is monitored.
Sampling Protocols and Study Designs • The researcher must identify the scale of selection to study consisting of resolution (grain) and extent (size). • The biology of the animal is important (e.g., if the animal being studied is territorial then selection is commonly studied on a different scale from that used for a non-territorial animal). • As a general rule, resource selection studies should consider selection at more than 1 scale. • Resource selection may be detected and measured by comparing any 2 of the 3 possible sets of resource units (used units, unused units, or units in the study area).
Sampling Protocols for Resource Units • Sampling protocol (SP) What is sampled? ________________________________________________________________________________ • SP-A Study area units are randomly sampled and used units are randomly sampled. • SP-B Study area units are randomly sampled and unused units are randomly sampled. • SP-C Used units are randomly sampled and unused units are randomly sampled. • SP-D Available units are randomly sampled and classified as used or unused. ________________________________________________________________
Design I • Units used by the population of animals are recorded (but, use by individual animals is not possible to record). • For example, in this design aerial or ground surveys are used to locate animals. • Variables that potentially influence selection of units by animals are measured at the locations. For example, vegetation or forage types, food availability, slope, aspect, and density of roads in a plot centered at the locations might be measured at each location and used in a model to predict the relative probability of selection of locations by animals in the population. • Maps, aerial photographs, or GIS might be used to provide sample or census data on study area plots or pixels.
Design II In some cases, the study area is defined for a population of animals, but individual animals are identifiable and habitat units selected can be recorded for unique animals. Four examples of this design are provided: 1. A random sample of uniquely identified animals is obtained from the population so that a sample of habitat units selected by a given animal can be recorded. Also, a sample of study area units is selected. Predictor variables are measured on units selected by the ith animal, and on the sample of study area units. Predictor variables might be measured in the field or from aerial photographs, GIS, or maps. 2. Animals are trapped, radio-marked, and their home ranges measured with the assumption that animals captured provided a random sample. A Design II study would involve comparison of proportions of resource types and other variables in home ranges to the same variables measured on similar sized regions randomly sampled from the entire study area. 3. Habitat within each animal’s home range is compared with the habitat in the entire study area. 4. Compared food selected by individuals of one species with individuals of a similar species with random samples of food from the entire study area.
Design III In this design, individuals are uniquely identified (usually by radio transmitters) or collected for stomach samples. Data from each animal are analyzed to provide a Resource Selection Function for each animal. Two examples of this design are provided: 1. The animals in a sample are radio-marked, and the relocations of an animal provide a sample of resource units selected by that animal. Resource units within an animal’s home range also are sampled. Predictor variables are measured on each sampled unit to contrast used units with units within each home range. 2. Individual animals might be collected and stomach analysis performed on each. Predictor variables are measured on prey or food items (e.g., species, color, size). These data are then contrasted to measurements from a sample of prey or food items collected in a certain size buffer surrounding the collection site.
Comparison of Designs • Design I has been the most commonly used in the past; however, it has the least specific information. Inferences can be made to resource selection by the population of animals with the assumption that study design and sampling protocol adequately samples habitat units selected by the population and in the study area. • Designs II and III tend to be preferred because data are obtained on individual animals and their habitat or food selection. Thus, variation in habitat selection among gender or age classes can be analyzed. However, cost of a resource selection study usually increases when individual animals are captured, marked, and tracked.
Assumptions for Designs I-III • Design I: that study design and sampling protocol adequately samples habitat units selected by the population and in the study area and there is an independence of locations of used units. • Designs II and III: that sample of animals was collected by a random procedure, not on the fact that data on individual animals might have lacked independence.
Models for Resource Selection Functions (RSFs) • Resource units usually are defined as individual items of food (with food selection) or blocks of land or points on the landscape (with habitat selection). Each resource unit is characterized by the values that it possesses for certain predictor variables (also called independent variables or covariates) X1, X2, ..., Xp, representing characteristics such as, size and color of food items, or the distance from water and the habitat type of habitat units. Three mathematical functions (i.e., models or curves) are involved in studies of resource selection. A RSF for the relative probability of use of resource units with a single variable X (adapted from McDonald and Manly 2001). The “available” curve is approximately a normal distribution with a mean of 20 and variance of 2.5. The “used” curve is approximately a normal distribution with a mean of 22 and variance of 1.9. These 2 distributions define the RSF.
Assumptions for Estimation of RSFs There are 6 major assumptions for estimating RSFs. 1. The researcher is interested in ranking habitat units (food units) in a study area based on the relative probabilities of selection by animals. 2. Predictor variables to be measured on sampled units are correlated with the probability of selection and do not change appreciably during the study period. 3. Measurement errors for predictor variables, X1, X2, ..., Xp, are relatively small in comparison to variation from unit to unit. 4. In Design I and II studies, animals in the population have equal access to all units in the study area. If this is not the case, e.g., if animals are territorial, Design III should be used. 5. Study area units are randomly sampled. 6. Selected units are randomly sampled or the probability of detection of selected units is approximately constant. If the probability of detection of use of a sampled unit is highly dependent on the vegetation type or other predictor variables then other more complex study designs are required .
Defining Study Areas and Measuring Habitat Selection Selection and use of a particular area or unit of habitat by an animal are the result of proximate and/or ultimate predictor (independent) variables. Proximate Variables: those features used as cues when an animal evaluates a site (habitat unit). They may include structural features such as understory cover, canopy height, slope, density of roads in the unit or distance to water. The presence/absence of other animals that may act as competitors or predators also may influence habitat selection. Animals may use such features as cues, but they may not be the same as the variables that have resulted in evolutionary associations between animals and habitat. Ultimate Variables: those parameters that affect an individual's abilities to reproduce, obtain food, and avoid predators are examples of ultimate variables that influence habitat selection. Studies of habitat selection usually involve measure of proximate variables and food availability. However, with adequate data on ultimate variables, for example, measurements of predator abundance and competition, a more complete understanding of habitat selection can be obtained.
Representative methods to examine habitat use patterns. “A” illustrates Design II and sampling protocol A: available habitat is inventoried and compared to the composition of an animal’s home range. “B” illustrates Design I and sampling protocol A: random samples are compared to characteristics of a sample of sites where use has been detected, such as nests or roost sites. “C” illustrates Design I and sampling protocol C: systematic plots (or points) are established and features are compared between sites where use was detected (via captures, tracks, feces, radio relocations, etc.) and sites where use did not occur. Techniques for Detection of Habitat Selection Direct and indirect methods have been used to detect wildlife habitat selection. Direct methods include observation, capture, and radio-telemetry whereas indirect methods are dependent on some evidence of animal activity within an area or specific site (e.g., bed sites, browsed twigs, feces, nests, or tracks). These measures may be used to detect use of units along systematic transects, in a small-mammal trapping grid, or with other sampling designs appropriate to the animal of interest.
Direct Methods for Detection of Habitat Selection Direct observations of animals may allow economical sampling of a large segment of the study area and to distinguish activities within vegetation types. Collection of data can be combined with aerial or other survey procedures. Problems to consider are differential visibility among vegetation types and the difficulty of recording observations during nocturnal periods. Advantages of animal capture include being able to examine individuals for age/gender and other characteristics. Capture procedures can be combined with mark-recapture statistics to estimate abundance. However, differential vulnerability to capture due to age and gender or other factors may bias results and attractants may cause animals to select vegetation types that are normally not selected. Radio-telemetry also can be used to measure habitat selection. Advantages include being able to examine individuals of known age/gender and other characteristics for habitat selection. Animals can be located multiple times throughout the day/night and seasons. Habitat selection for important components (e.g., den site selection or roost sites) can be studied.
Indirect Methods for Indication of Habitat Selection Detection of Tracks: allows one to sample units economically and detect use in a large sample of units in a short time by all segments of the populations. However, the procedure often suffers from lack of good tracking conditions (e.g., uniform snow) and different visibility of tracks in different vegetation types. Detection of Pellet Groups or Scat: measures selection by all segments of a population. With cleared plots, information on seasonal selection is obtained, and potentially can be combined with deposition rates to estimate density of animals. However, defecation rates often are unknown or vary with habitat type and activity, and decomposition rates may vary among habitats. Visibility and detection of pellet groups also may vary with vegetation type. Browsing or Feeding: may provide evidence of use of habitat units by all segments of a population. This technique may provide additional information on food habitats and be combined with studies of carrying capacity. Potential biases include competition for the same food by other species and food species must be present before use of a unit can be documented.
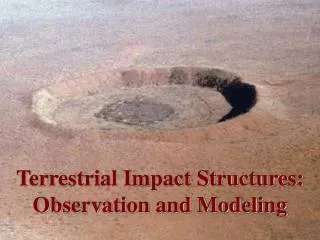
Techniques to Define Study Areas Issues with the definition of the study area are simplified if the scale of selection is clearly delineated. First-order Selection: the selection of physical or geographical range of a species. Few if any habitat selection studies are of first-order selection. Second-order Selection: results in the home range of an individual or social group within the physical or geographical range of a species. Second-order selection is of interest in many habitat-selection studies and will typically require radio-marking of individuals or social groups (Design II and III studies). Third-order Selection: selection of sites within the home range. Typically, home range of an individual or social group is calculated by the minimum convex polygon method and all units within the home range define the study area. Fourth-order Selection: the actual procurement of food items from those available at a feeding site as identified by third-order selection.
Guidelines The guidelines presented below may be helpful when study area boundaries are delineated for second-order selection or Design I studies. Size of the study area should be substantially larger than the home range of the study species. Numbers of study animals, groups, or social units present on the study area should be, as far as possible, adequate for study. An opportunity should exist for independent locations of animals or independent location of home ranges within the study area (i.e., as close as possible to an unbiased random sample of sites selected by animals or a random sample of home ranges). Study area boundaries should be chosen with consideration of the biology of the animal. Physical barriers such as rivers or mountain ranges might make better boundaries than an arbitrary (geopolitical) straight line on a map.
Techniques to Measure Food Availability in Resource Selection Studies Abundance and distribution of food resources are among the major environmental features that influence habitat selection. Because food intake relates to energy needs, reproduction and ultimately to survival, understanding food selection is a fundamental component of behavioral ecology. Wildlife food abundance can be estimated for an area by measuring the annual production of herbaceous plants, woody stems, fruits, and seeds, or by assessing the abundance of potential prey. Availability suggests a food resource is both accessible and usable. Access to food resources can vary with weather or by the presence of predators or competitors. In resource selection studies, effects that modify food abundance might be modeled using covariates such as snow depth or presence of a predator or competitor.
Grasses and Forbs • Clipping and Weighing: dried samples of above ground vegetation is the most accurate, but most time-consuming, technique for measuring predictor variables for availability of herbaceous plants. Many techniques have been developed to more rapidly estimate vegetative biomass and to avoid destructive sampling. These include: • Obstruction of Vision: as measured by Robel range pole methods Estimating Biomass: in small quadrats. • Estimating Percent Cover:by species in small sample plots. • Pin Intercept Methods: have been developed using sampling frames containing rows of pins that are pushed through the vegetation. • Notched Boot: while walking through an area, at regular intervals, the species of plant nearest a notch in the tip of the boot is recorded.
Browse • Predictive Equations: have been developed that relate measures of shrub size to forage production and hence, estimation of the amount of browse in a study unit as predictor variables. Specific equations must be estimated for each species and for individual study sites. • The Twig-count Method: estimates biomass of browse by calculating the average weight of edible material in a single twig and multiplying that value times the number of twigs. A sample of previously browsed twigs is used to estimate the average browsing diameter for each forage species. Mass of browsed twigs is then estimated from a collection of twigs clipped to the size of the average browsed twig. • Densities of Twigs: can be estimated from counts on circular plots or belt transects, and browse biomass is calculated per unit area. Modifications of this technique include development of equations that use unbrowsed twig length or basal diameter to estimate twig mass.
Fruits and Seeds • Fruits and Seeds: from low-growing herbs and shrubs can be counted and averaged per plant and summed over an area to estimate biomass in study units. • Hard Mast Crops: such as acorns, can be collected in funnel traps that sample an area under the canopy. Although traps usually prevent animals from taking mast once it has fallen from the tree, information on production can be biased if seeds are consumed before falling to the ground.
Design Considerations and Analysis to represent or be highly correlated with the variables used by animals to evaluate a site and often include some measurement of food abundance, cover, and structural characteristics General Considerations Frequently, investigators have focused on modeling selection of habitat units during specific periods of time of day or behavior: feeding, resting, or rearing young. The most common study design (SP-A) would involve collection of a sample of selected units, such as locations of radio-marked animals, and contrast those units with a sample of units in the study area. In this case, the models yield estimates of the relative probability of selection (i.e., information to the effect that one unit might be selected with twice or 3 times the probability that another unit is selected). A valid probability sampling procedure is used to sub-sample a variety of features at each study site, cell, or home. The features selected to describe a sampled unit (e.g., litter depth, understory stem density, canopy closure, distance from roads, aspect, slope) are assumed An example of nested plots used to sample ground litter, understory stem density, and overstory composition (modified from Dueser and Shugart 1978).
Measurement of Landscape Variables Using a GIS • A Landscape: is a mosaic of habitat patches in which a patch of interest is embedded. • Landscape Variables: include patch size, patch context, and other habitat characteristics (e.g., density of roads, proportion of habitat types, or density of edge between habitat types in a buffer (circle) centered at the site. • Because the actual habitat features influencing selection are not known, measuring several features is appropriate. However, as the number of features measured becomes large, the chance of detecting spurious relationships also increases. Therefore, the list of features to be sampled should be limited to those based on biological considerations for the relationships between animals and their habitats.
Standard Statistical Analyses • Analytical methods for resource selection studies usually involve comparison of characteristics of samples or censuses of used units and samples of units from the study area. The first step should involve graphical and descriptive comparisons of the distribution of the predictor variables (also called covariates) that describe each unit for the samples being compared (e.g., used vs. study area). Patterns described in these analyses probably will be apparent in any inferential analyses (e.g., hypothesis testing). Inferential analyses include: • Chi-square Analyses for Categorical Data • Modeling Resource Selection • Selection Ratios for Categorical Data • Resource Selection Function for Categorical Data • Estimation of a RSF for Categorical Data Using Logistic Regression
Chi-square Analyses for Categorical Data • For data based on resource categories (e.g., vegetation types, food types, or categorized continuous predictors), a Chi-square test can provide an omnibus answer to the question: is there evidence of selection or not? This test is appropriate when individual observations of selected units are considered independent. Chi-square analyses appear most appropriate in the Design I case and are not appropriate when several animals have multiple (dependent) relocations. • The form of test statistic that is most commonly used for this purpose is the Pearson statistic, which takes the form • where Oiis an observed sample frequency, Eiis the expected value of Oi according to the hypothesis being considered, and the summation is over all resource categories. • Eighty percent of all cells should have expected values of 5 or more, otherwise, the standard Chi-square distribution may not be an accurate approximation to the sampling distribution of the statistic.
Modeling Resource Selection Selection Ratios for Categorical Data SR = % of locations % of Study area • The selection ratio (SR) for a given resource category is the ratio of the proportion used to the proportion of the category in the study area. If the ratio is close to 1, there is evidently no selection. Values smaller than 1 indicate selection against that category; large values indicate selection for the category. Selection ratios, and standardized selection ratios are calculated with 95% Bonferroni adjusted confidence limits (CL). If CL do not overlap, then values are considered different.
Resource Selection Function for Categorical Data Using Logistic Regression • Logistic regression is a specialized regression tool for working with multiple continuous and discrete variables. However, logistic regression also can be used to analyze the effect of a single categorical response variable on resource selection (e.g., the effects of the 4 habitat categories on selection of locations by an animal. • The technique is presented as a means to analyze selection among categories of a categorical variable and as an introduction to estimation of a RSF when there are multiple variables.
Multiple Continuous and Discrete Variables • The estimation of RSFs is presented as a unified theory for study of the relationships between selection of units and multiple predictor variables measured on those units. These functions allow one to estimate the relative probabilities that habitat units were selected and to rank units according to their value for use by wildlife for the study area, population, and time period. • Modeling of resource selection is introduced for computation of selection ratios among categories of vegetation types or food types. Logistic regression is the basic tool by which all example sets of data in this chapter are analyzed; it is used to analyze data to illustrate the concepts of relative probabilities of selection among vegetation types. Information theory and maximum likelihood procedures are used for selection of multiple predictor variables for the RSFs.
SUMMARY • Habitat use and food selection by wildlife in comparison to available habitat and food is used to identify important habitat patches and food resources. Selection is defined if resources are used disproportional to their availability at a given scale: geographical range of a species, home range of an individual or social group, selection of sites within a home range, or procurement of food items at a feeding site. Generally, resource selection studies should consider selection at more than 1 scale and should be replicated in time and space. • Study area and selected units should be randomly sampled. Resource units are defined as individual items of food (with food selection) or blocks of land or points on the landscape (with habitat selection). Models for Resource Selection Functions were developed as a unified theory for study of the relationships between selection of units and predictor variables measured on those units. These functions allow one to estimate the relative probabilities that habitat units were selected and to rank units according to their value for use by wildlife for the study area, population, and time period. • Logistic regression is the basic tool by which data are analyzed; it is used to analyze data to illustrate the concepts of relative probabilities of selection among vegetation types.