Download
1 / 18
180 likes | 295 Vues
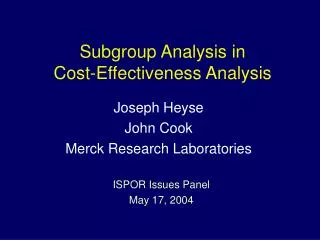
This presentation by Joseph Heyse and John Cook delves into the critical role of subgroup analysis in cost-effectiveness evaluations of clinical trials. It highlights the importance of understanding treatment-covariate interactions, where the effectiveness of treatment can vary by patient characteristics, such as age or gender. The analysis focuses on identifying subgroups with differing treatment effects, testing for qualitative and quantitative interactions, and evaluating the homogeneity of cost-effectiveness ratios across different patient demographics.

E N D
Subgroup Analysis inCost-Effectiveness Analysis Joseph Heyse John Cook Merck Research Laboratories ISPOR Issues Panel May 17, 2004
Definition Encyclopedia of Biostatistics Subgroup Analysis in Clinical Trials see Treatment-Covariate Interaction
Treatment-Covariate Interaction • A treatment-covariate interaction exists when the effect of a treatment varies according to the value of a specific covariate. • Covariates are defined according to patient characteristics such as gender, race, age, study center country, or disease risk factors. Subgroups are sets of patients with common values of covariates.
Importance Identifying and evaluating interactions is a key step in the analysis of clinical trial data. • Assess the appropriateness of an overall estimate of treatment effect. • Improve precision of estimated treatment effect. • Adjust estimate of treatment effect for common value of covariates. • Explore the consistency of the treatment among subgroups. • Identify subgroups of patients with greater/lesser levels of treatment effect.
Characterizing Interaction(Gail and Simon, 1985) Quantitative: Treatment effect varies among the subgroups of patients. Qualitative: The direction of the true treatment differences varies among the subgroups of patients. This is sometimes called crossover interaction.
Test of Quantitative Interaction(Gail & Simon, 1985) Suppose there are K countries, each with mean treatment effect Diand standard deviation Si • Compute: • where • Compare H to 2 with K-1 d.f. Large value of H implies treatment differences exists among countries/centers
Test of Qualitative Interaction #1(Gail & Simon, 1985) • Compute Q- and Q+ for positive and negative differences: • Test Statistic: Large value of Q implies differences exist in direction of treatment effect among countries
Test of Qualitative Interaction #2(Piantadosi & Gail, 1993; Pan & Wolfe, 1997) • Construct confidence intervals for each country (Li , Ui):Di ± Z • Si, fori = 1, 2…, K where * = ½(1-PK) PK = 2(1-)1/(k-1) - 1 • Qualitative interaction exists if there are two countries (iandj)with intervals such that: Ui < 0 and Lj > 0 • Pan & Wolfe discuss relative merit of methods
Scandinavian Simvastatin Survival Study (4S) • Randomized, double-blind, placebo-controlled, N=4444 patients in Scandinavian countries. - Denmark (N=713) - Norway (N=1025) - Finland (N=868) - Sweden (N=1681) - Iceland (N=157) • Patients with previous MI followed median period of 5.4 years. • Simvastatin therapy associated with 30% reduction in deaths and 34% fewer hospital days.
.18 Unit Line .16 .14 .12 Denmark .10 Overall Simvastatin Norway .08 Sweden Iceland .06 Finland .04 .02 0 .10 .12 .14 .16 .18 0 .02 .04 .06 .08 Placebo 4S: Proportion of Patients Dying by Country for Placebo and Simvastatin Patients
Unit Line .18 .16 .14 Denmark Sweden Overall .12 Norway Finland .10 Simvastatin .08 Iceland .06 .04 .02 0 .10 .12 .14 .16 .18 0 .02 .04 .06 .08 Placebo 4S: Cardiovascular Hospitalizations Per Patient Year by Country for Placebo and Simvastatin Patients
Testing for Interaction: CE Ratios • Homogeneity among countries in costs and effects does not imply homogeneity in the ratio • Challenges with the CE ratio • Analytic challenges: • Lack of uniqueness with ratio • When E = 0 • Conceptual challenge: • What is a qualitative interaction? • Recommend using an angular transformation of the CE Ratio. ISPOR Issues Panel 2004.ppt.12
Angular Transformation • Apply angular transformation to (∆C, ∆E) to obtain the CE angle: Tan-1 [C / SD(C) , E / SD(E)] if C 0 180o +Tan-1 [C / SD(C) , E / SD(E)] if C < 0 • Construct 95% confidence limits for angle (counter clockwise and clockwise limits) • Can use either normal theory or percentile bootstrap methods • Must reverse transform angles back to ratios!
Testing for Interaction: CE Ratio • What is a qualitative interaction for the ratio: • Requires specification of CE threshold () • CE ratios “below” are deemed cost-effective • CE ratios “above” are deemed not cost-effective • Qualitative interaction exists if some countries are cost-effective, while others are not.
2500 Finland Overall Denmark 2000 Norway Sweden Iceland 1500 Incremental Cost (U.S.$) 1000 500 0 0.02 0.03 0.04 0.05 0.00 0.01 Incremental Survival Probability 4S: CE Ratio = 75K
4S: Cost Per Additional Survivor with 95% Confidence Intervals ISPOR Issues Panel 2004.ppt.16
Concluding Remarks • It is important to assess the consistency of treatment effects on costs, effects, and cost-effectiveness across subgroups of patients. • This analysis includes a characterization of possible interactions being quantitative or qualitative. • Available tests for interaction can be applied to cost-effectiveness ratios and net health benefits. • The results of the analysis can be used to improve the precision of the estimate and evaluate the generalizability of study conclusions.
Selected References Armitage P and Colton T, Editors. Encyclopedia of Biostatistics, Volume 6, John Wiley & Sons: New York, 1998. Gail MH and Simon R. Testing for qualitative interactions between effects and patient subsets. Biometrics 1985; 41:361-372. Pan G and Wolfe DA. Test for qualitative interaction of clinical significance. Statistics in Medicine 1997; 16: 1645-1652. Cook JR, Drummond MF, Glick H, and Heyse JF. Assessing the appropriateness of combining economic data from multinational clinical trials. Statistics in Medicine 2003; 22:1955-1976. Cook JR and Heyse JF. Use of an angular transformation for ratio estimation in cost-effectiveness analysis. Statistics in Medicine 2000; 19:2989-3003.