Amplification Plots of Real-Time PCR with Protein-Binding Sites
10 likes | 97 Vues
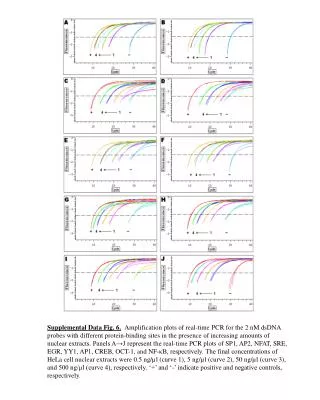
Explore real-time PCR plots for different protein-binding sites in the presence of various nuclear extracts amounts. Investigate SP1, AP2, NFAT, SRE, EGR, YY1, AP1, CREB, OCT-1, and NF-κB. Positive and negative controls included.

Amplification Plots of Real-Time PCR with Protein-Binding Sites
E N D
Presentation Transcript
Supplemental Data Fig. 6.Amplification plots of real-time PCR for the 2 nM dsDNA probes with different protein-binding sites in the presence of increasing amounts of nuclear extracts. Panels A→J represent the real-time PCR plots of SP1, AP2, NFAT, SRE, EGR, YY1, AP1, CREB, OCT-1, and NF-κB, respectively. The final concentrations of HeLa cell nuclear extracts were 0.5 ng/µl (curve 1), 5 ng/µl (curve 2), 50 ng/µl (curve 3), and 500 ng/µl (curve 4), respectively. ‘+’ and ‘-’ indicate positive and negative controls, respectively.