Download
1 / 71
720 likes | 933 Vues
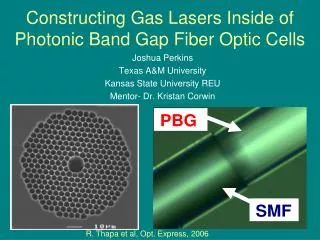
Photonic Band Gap Accelerator Experiments. Roark Marsh Massachusetts Institute of Technology, Plasma Science and Fusion Center Accelerator Seminar 1/27/2009. Talk Outline. Introduction Photonic Band Gaps Photonic Band Gap Higher Order Modes MIT Accelerator

E N D
Photonic Band Gap Accelerator Experiments Roark Marsh Massachusetts Institute of Technology, Plasma Science and Fusion Center Accelerator Seminar 1/27/2009
Talk Outline • Introduction • Photonic Band Gaps • Photonic Band Gap Higher Order Modes • MIT Accelerator • Photonic Band Gap Wakefield Measurements • Photonic Band Gap Breakdown Experiments
Introduction • Standard Model • Large Hadron Collider: LHC • International Linear Collider: ILC • Compact Linear Collider: CLIC • High Gradient Acceleration
Higgs Boson • Remaining/Open issues for Standard Model • Unitarity of Z,W interactions • All Field Theory particles massless • Higgs Mechanism is the Standard Model solution to these problems
Large Hadron Collider • LHC is a 14 TeV proton collider • Construction complete, being commissioned • Will discover Higgs Boson
International Linear Collider • ILC is a superconducting electron-positron linear collider • 500 GeV in 30 km • Precision Higgs physics after LHC discovery • 31 MV/m gradient
CLIC • Compact Linear Collider • Multi-TeV 2 Beam accelerator concept • Feasibility study being done at CERN • ~100 MV/m normal conducting high gradient structures
High Gradient Acceleration • Gradient Limits • Trapping • Breakdown • Pulsed Heating • High frequency • Wakefields scale with frequency cubed:
Wakefields and HOMs Wakefields: beam excitation of unwanted modes A bunch of highly relativistic charges transits a cavity Electric field “wake” can be written as a sum over cavity eigenmodes These modes can be excited by a bunch Modes are now resonating in cavity, can affect subsequent bunches
Summary Standard model predicts Higgs Boson LHC will discover the Higgs Boson ILC required for precision Higgs physics Normal conducting high gradient structures required for next generation of linear colliders High frequency structures require wakefield damping
Photonic Band Gaps • One dimensional example • Two dimensional formalism • Parameters • Experimental work
Photonic Band Gaps • Frequency range in which there is total reflection • 1D Example: Bragg reflector Band Gaps
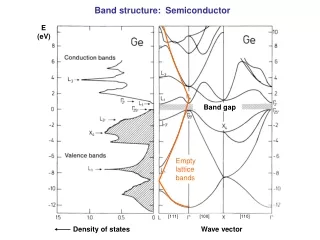
Dispersion Relations • Bloch wave vector, k • Γ→X→J →Γ • Plot ω versus k • Lines on curve are modes • For a given frequency, what if there is no solution? • No propagation TM TE
a/b Ratio • Only one free parameter in design: rod radius to rod spacing ratio • Frequency used to fix one of a or b • Ratio determines gap properties a TM b b b
Higher Order Modes? 2D Theory says complete band gap No higher order eigenmodes: no HOM wakefields Frequency tunable material Looks like a wall for operating mode Looks like vacuum for higher frequency modes Solves Wakefield issue Operating mode confined Wakes leak out No HOMs
PBG Accelerator Structures First PBG structure designed, built, tuned and tested with beam Structure achieved 35 MeV/m* limited by available power and structure design for first results * Smirnova et al. PRL, 2005
Motivation Acceleration demonstrated but what about HOMs? 2D Theory predicts all HOMs in propagation band PBG HOM Damping in practice is more complicated 3D Structure with disk loading (irises/plates) Propagation band means damping, but how much? No HOMs
Summary Bragg filters are a 1D example of a PBG 2D is more complicated Only one free parameter: ratio a/b No HOMs expected in PBG accelerators PBG accelerator demonstrated at MIT
PBG Simulations • High Frequency Structure Simulator: HFSS • Operating Modes • Higher Order Modes: HOMs • Structure Cold Test
High Frequency Structure Simulator • Full-wave 3D EM field solver: HFSS by Ansoft • Used for both eigenmode and driven solutions
Operating Modes • TM01 on-axis electric field for acceleration • Pillbox walls confine fields • Rods confine mode because it is in the Band Gap PBG a/b=0.3 Pillbox PBG a/b=0.15
Dipole Modes? • Dipole modes observed in simulation • Artifact of metallic boundary? • Perfectly Matched Layer PBG a/b=0.15 Pillbox No HOMs
Lattice HOMs • Quality factor gives quantitative gauge of damping • HOMs present, but strongly damped in 3D HOMs No HOMs PBG a/b=0.3 Pillbox PBG a/b=0.15 Q=9000 Q=100 Q=1000
Cold Test of PBG HOMs Low Q Lattice HOMs • 17.14 GHz • Q = 4000 • group velocity = 0.0109 c • Lattice HOMs • Q < 250
Summary HFSS used for field simulations Operating mode in PBG like pillbox TM01 HOMs in fact observed in simulations Lattice HOMs: very low Q from high diffractive loss Low Q Lattice HOMs seen in PBG structure cold test
PBG Wakefields • MIT HRC 17 GHz Accelerator • Experimental Setup • Simulations • Theory • Measurements
MIT 17 GHz Accelerator 700 kV 500 MW Modulator HRC Relativistic beam Klystron: Microwave Power Source 25 MW @ 17.14 GHz Structure Test Stand Photonic Bandgap Accelerator 25 MeV Linac: 0.5 m long 94 cells
Accelerator Schematic Klystron RF Auxiliary Output Prebuncher Chopper Haimson Deflector Steering Linac Bias Lens Beam Monitor Toroidal Lens DC Gun
Experimental Setup Structure is unpowered DC injector produces a train of bunches Matched load on input port Diode detector observations made through output port and vacuum chamber windows Diode Load 1/17GHz = 60ps 100ns Horn & Diode
Experimental Setup Pictures Matched Load Output Port Window View from Below Chamber Window
PBG Multi-Bunch Simulation Output Port Matched Load Bunch train with 1 mm rms bunch length and 17.5 mm spacing driven through structure Chamber window
PBG Multi-Bunch Simulation Output Port Matched Load Bunch train with 1 mm rms bunch length and 17.5 mm spacing driven through structure Chamber window
PBG Multi-Bunch Simulation Output Port Matched Load Bunch train with 1 mm rms bunch length and 17.5 mm spacing driven through structure Chamber window
PBG Multi-Bunch Simulation Output Port Matched Load Bunch train with 1 mm rms bunch length and 17.5 mm spacing driven through structure Chamber window
PBG Multi-Bunch Simulation Output Port Matched Load Bunch train with 1 mm rms bunch length and 17.5 mm spacing driven through structure Chamber window
Simulation of PBG Lattice HOMs Electric field from HFSS simulations of PBG Train of bunches means harmonics of 17.14 GHz Dipole mode not going to be observed Lattice HOM: 34 GHz, Q = 100 Fundamental: 17 GHz, Q = 4000
Traveling Wave Theory • Use cold test of structure to establish mode properties • Insertion loss • Group velocity • Mode Q • Traveling wave theory for mode excitation • Power emitted by beam can be expressed analytically
Measured 17 GHz Wakefields Output Port diode measurement No fitting parameters, excellent agreement Pb (Theory)
Measured 34 GHz Wakefields Output Port diode measurement Simulations within an order of magnitude Quadratic fit
Experimental Results Summary Summary of measurements for 100 mA average current Observations made on Chamber window as well as Output Port Multiples of 17.14 GHz observed up to 85.7 GHz with heterodyne receiver
Summary PBG wakefields observed 17 GHz results agree quite well with traveling wave theory 34 GHz results can be explained by wakefield simulations to within an order of magnitude
PBG Breakdown • SLAC standing wave breakdown experiments • PBG structure design • PBG cold test and status • Preliminary results
SLAC Setup • TM01 Mode Launcher • Standard rectangular waveguide to cylindrical TM01 mode conversion • Peak field kept low • Single Cell SW Cavity • Consists of input and end coupling cells for matching • Central test cell • ½ field in matching cells, full field only in test cell • New design uses PBG as central test cell
Breakdown Rate vs Gradient Pillbox #1 Pillbox #2 Pillbox #3 Accelerating Gradient [MV/m] *Dolgashev, AAC 2008
X Band PBG Structure Test • SLAC test stand with reusable TM01 mode launchers • MIT designed PBG structure for high power testing • Under high power testing
Design Results • Designed to have ½ field in each pillbox coupling cell, only full field region is in PBG “test” cell • Coupling optimized by minimizing S11 reflection from TM01 Mode launcher Field on axis S11 Coupling reflection
X Band PBG Single Cell Structure • Central PBG test cell • Pillbox matching cells • First iris radius varied to optimize coupling ½ Field Full Field PBG Structure Experiments, AAC 2008
Electric Field Plots • Electric field plots: top and side views • 5.9 MW in = 100 MV/m gradient = 208 MV/m surface field on iris
Magnetic Field Plots • Magnetic field plots: top and side views • 5.9 MW in = 100 MV/m gradient = 890 kA/m surface field on inner rod