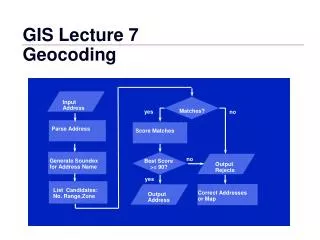
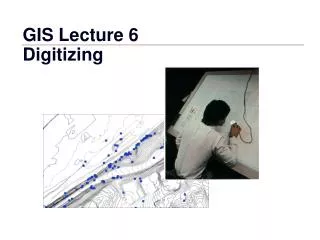
GIS Lecture 6 Digitizing
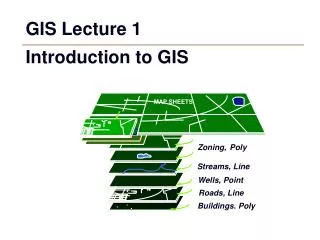
GIS Lecture 6 Digitizing. Outline. Digitizing Overview Digitizing Sources GIS Features Creating and Editing Shapefiles in ArcView Spatial Adjustments Conclusion. Copyright– Kristen S. Kurland, Carnegie Mellon University. Digitizing Overview. Why Digitize?. New maps

GIS Lecture 6 Digitizing
E N D
Presentation Transcript
GIS Lecture 6 Digitizing
Outline • Digitizing Overview • Digitizing Sources • GIS Features • Creating and Editing Shapefiles in ArcView • Spatial Adjustments • Conclusion Copyright– Kristen S. Kurland, Carnegie Mellon University
Why Digitize? • New maps • Map features are wrong • Missing features Copyright– Kristen S. Kurland, Carnegie Mellon University
Heads Down Digitizing • Digitizing table or tablet Copyright– Kristen S. Kurland, Carnegie Mellon University
Heads Up Digitizing • Mouse on a screen • Digitizes paper maps, aerial photos, or other images Copyright– Kristen S. Kurland, Carnegie Mellon University
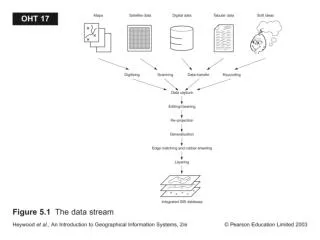
Digitizing Sources • Orthophotos • GPS • Paper Maps • Scanning • Raster to Vector Conversion Copyright– Kristen S. Kurland, Carnegie Mellon University
Orthophotography • Digital imagery in which distortion from the camera angle and topography have been removed, thus equalizing the distances represented on the image • Can be used to measure true distances • http://gis.esri.com/library/userconf/proc95/to150/p124.html Copyright– Kristen S. Kurland, Carnegie Mellon University
DOQQs • Digital Ortho Quarter Quadrangles • Produced by the U.S. Geological Survey (USGS) • Grayscale or color-infrared (CIR) images • 1-meter ground resolution; • Cover an area measuring 3.75- minutes longitude by 3.75-minutes latitude, approximately 5 miles on each side • Referenced to the North American Datum of 1983 (NAD83) and cast on the Universal Transverse Mercator (UTM) projection. Copyright– Kristen S. Kurland, Carnegie Mellon University
Image Resolutions • The amount of detail found in one pixel of the image. • image with one meter resolution means that each pixel in the image represents one square meter on the ground. 30 meters 10 meters 5 meters Copyright– Kristen S. Kurland, Carnegie Mellon University
Image Resolutions (Continued) 2 meters 1 meter Copyright– Kristen S. Kurland, Carnegie Mellon University
Resources Copyright– Kristen S. Kurland, Carnegie Mellon University
Resources (Continued) Copyright– Kristen S. Kurland, Carnegie Mellon University
Resources (Continued) Copyright– Kristen S. Kurland, Carnegie Mellon University
Resources (Continued) Copyright– Kristen S. Kurland, Carnegie Mellon University
Resources (Continued) Copyright– Kristen S. Kurland, Carnegie Mellon University
Resources (Continued) Copyright– Kristen S. Kurland, Carnegie Mellon University
Resources (Continued) Copyright– Kristen S. Kurland, Carnegie Mellon University
Resources (Continued) • Google Maps Copyright– Kristen S. Kurland, Carnegie Mellon University
Resources (Continued) • Google Earth
GPS • Department of Defense built the global positioning system (GPS) in the 1970s • Network of up to 24 satellites in earth orbit • Opened it up to civilian use in the 1980s – free of charge • GPS uses triangulation from signals from the satellites • Base stations are fixed receivers that help GPS signals get accuracy within 1 to 5 meters
GPS (Continued) • Easy to input GPS data into GIS • GPS is most valuable when there are no base maps sufficient to guide drawing new features
National Spatial Reference System • National network of control points (small brass disks with identifiers and marks) placed on permanent structures such as concrete posts • National Geodetic Survey (NGS) establishes the known points • Surveyors take measurements (angles and distances) from known locations to accurately locate points and boundaries • By the early 1990s, GPS became the dominant method for establishing control points • Some cities maintain their own points
National Spatial Reference System • City of Pittsburgh control point benchmark
Paper Maps • Historic Maps • http://www.usgsquads.com/svcs_historic_maps.htm#Historic • http://digital.library.pitt.edu/maps/ • Historic maps of Pittsburgh and Allegheny County from 1872-1939 Copyright– Kristen S. Kurland, Carnegie Mellon University
Scanning Paper Documents • Scanned maps and images become vectors • Special software needed Copyright– Kristen S. Kurland, Carnegie Mellon University
Raster to Vector Conversion Copyright– Kristen S. Kurland, Carnegie Mellon University
Raster to Vector Conversion Copyright– Kristen S. Kurland, Carnegie Mellon University
1 2 3 node 0 0 Points • Nodes • Single points • Alone or at endpoints of lines Copyright– Kristen S. Kurland, Carnegie Mellon University
1 2 3 node vertex 0 0 Points • Vertices • Control the shape of lines Copyright– Kristen S. Kurland, Carnegie Mellon University
1 2 3 node vertex 0 tic 0 Points • Tics • control points used to register the map to the geographic space Copyright– Kristen S. Kurland, Carnegie Mellon University
1 2 Lines • Connected Nodes and Vertices • Single or multipart features node 0 line 0 Copyright– Kristen S. Kurland, Carnegie Mellon University
Lines From Node To Node Copyright– Kristen S. Kurland, Carnegie Mellon University
Line Features with Vertices Vertex Copyright– Kristen S. Kurland, Carnegie Mellon University
TIGER LINE Files Copyright– Kristen S. Kurland, Carnegie Mellon University
TIGER Street Centerlines Copyright– Kristen S. Kurland, Carnegie Mellon University
TIGER Street Centerlines Copyright– Kristen S. Kurland, Carnegie Mellon University
Polygons • Closed lines • Single polygons or multipart features (e.g. Hawaiian islands can be multiplepolygons as one feature) 4 3 1 2 node 0 polygon 0 Copyright– Kristen S. Kurland, Carnegie Mellon University
Creating New Shapefiles • Create new point, line or polygon shapefile in ArcCatalog • Add Spatial Reference Information (optional) • Add New Shapefile in ArcMap • Edit shapefile to add features and attributes • Stop editing • Save edits as part of new shapefile Copyright– Kristen S. Kurland, Carnegie Mellon University
New Shapefiles - ArcCatalog • Cannot create shapefiles in ArcMap Copyright– Kristen S. Kurland, Carnegie Mellon University
Add Shapefile in ArcMap Copyright– Kristen S. Kurland, Carnegie Mellon University
Heads Up Digitizing • Add base layers if necessary Copyright– Kristen S. Kurland, Carnegie Mellon University
Heads Up Digitizing • Add Editor Toolbar Copyright– Kristen S. Kurland, Carnegie Mellon University
Heads Up Digitizing • Start Editing Copyright– Kristen S. Kurland, Carnegie Mellon University
Heads Up Digitizing • Begin Digitizing • Click Sketch Tool Copyright– Kristen S. Kurland, Carnegie Mellon University
Heads Up Digitizing • Start Drawing Points
Heads Up Digitizing • Stop Editing • Save Edits
Heads Up Digitizing • Add attribute information