Download
1 / 30
310 likes | 440 Vues
This report presents an independent assessment of ISO-NE's energy and peak demand forecasting models. The project aims to compare ISO-NE’s methodologies against industry standards and offers recommendations for enhancements. The findings include analyses of long-term and short-term forecasting aspects, seasonal peak models, and the impact of temperature and humidity. Diagnostic tests assess model fit and forecasting accuracy. With a thorough exploration of methodologies, this evaluation serves as a blueprint for improving future electricity demand forecasts.

E N D
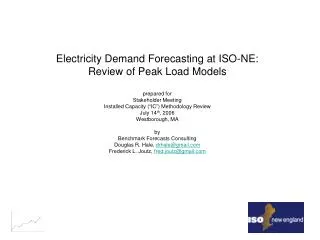
Electricity Demand Forecasting at ISO-NE: Review of Peak Load Modelsprepared forStakeholder MeetingInstalled Capacity (“IC”) Methodology ReviewJuly 14th, 2006Westborough, MAbyBenchmark Forecasts ConsultingDouglas R. Hale, drhale@gmail.comFrederick L. Joutz, fred.joutz@gmail.com
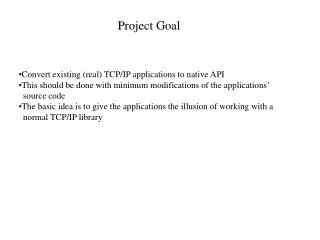
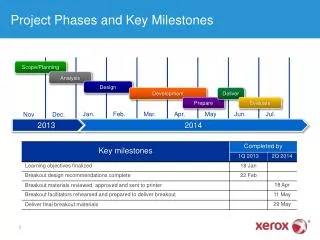
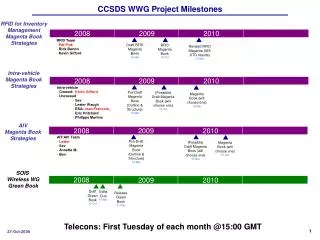
Project Goal and Milestones • Goals • Provide an independent evaluation of ISO-NE’s energy and peak demand forecasting models • Compare ISO-NE’s methodology with industry • Recommendations for improving models and forecasts • Milestones • Briefing and preliminary report June 8th. • Draft report and briefing late June / early July • Final report early / mid July • Long Run and Medium Term Forecasting Models • Short Run and Peak Forecasting Models
Preliminary Findings on ISO-NE’s Energy Models and Methodology • The ISO-NE forecasting methodology • The short term energy model forecasts demand two years out • The long term energy model forecasts annual demand ten years out • We have examined the peak demand forecasts
Replication of Seasonal Peak Models • Peak Models for Resource System Planning 2006 (RSP06) • Winter • May • June • July • August • September • Sample Weekdays January 1992 through August 2005
Replication of Seasonal Peak Models • Winter Peak Model Specification is Standard and includes • a Base Load trend • Heating Degree Day Measure • Monthly Dummy Variables • Monday and Friday Effects • Separate Summer Peak Model Specification is Standard and includes • A Base Load Trend • 3-Day Weighted Temperature Humidity Index (SWTHI) • Heat Wave Variable • Monday and Friday Effects • Peak(t) = a0 + a1 Bnel(t) + a2 SWTHI(t) + a3 HW(t) + a4 Days • We were able to replicate the Seasonal Peak Models
Replication of Summer Seasonal Peak Models • The Separate Monthly Summer Peak Models are driven by • the SWTHI and • the Base Load Trend • The SWTHI coefficient is larger .the warmer the month • The Base Load coefficient suggests about a 1.6 to 1.8 percent increase per year all else equal. • The Heat Wave Variable is better at capturing daily loads rather than peaks. It does not provide much in the way of explanatory power. • The Peak and SWTHI series are not normally distributed. It may suggest estimating the model in natural logarithms. • There is slight autocorrelation in the estimated equations. This may be a specification issue.
Alternative Seasonal Peak Models Considered • Convert Variables (Peak and SWTHI) to Natural Logarithms before Estimation • Control for First Order Serial Correlation • Modify Specification to ADL Autoregressive Distributed Lag • The specification is the same as current except that lagged values of • dependent variable and SWTHI are included. • Peak(t) = a0 + a1 Peak(t-1) + a2 Bnel(t) + a3 SWTHI(t) + a4 SWTHI(t-1) + … • The ADL model in levels or natural logarithms demonstrates a significant • increase in explanatory power.
Cooling Load Indexes • Cooling Load Index (CLI) • Base-Cooling Load Index (BCLI) • Estimated from Daily Peak Models • Peak Load(t) = b0 + b1 CDD(t) • CLI(t) = b1(t) / b1(1992) • BCLI(t) = b0(t) / b0(1992) • Able to Replicate these models and the Normalizations with Trends • Tested whether adjusting for July August vs. May September made a difference. None found.
Coefficient on WTHI a measure of peak load sensitivity to temperature/humidity • Indexed to 1992 value • Estimate a trend • Strong growth over historical period Doubling 1992-2005 • Increasing penetration of Air Conditioning • Constant a measure of peak load dependent on more general economic conditions • Indexed to 1992 value • Estimate a trend • Slower growth over historical period 16% increase 1992-2005 • Heating Index and Heating Base Load Index for heating season (Jan-Apr,Oct-Dec)
Trend Load Factor vs. Constant obs LFA_F LFWN_F LFA_Lev LFWN_Trend 2000 0.645 0.62 2001 0.563 0.605 2002 0.571 0.589 2003 0.605 0.584 2004 0.627 0.584 2005 0.573 0.577 2006 0.596 0.584 0.573 0.577 2007 0.593 0.581 0.573 0.577 2008 0.591 0.578 0.573 0.577 2009 0.588 0.575 0.573 0.577 2010 0.586 0.572 0.573 0.577
Specification of the Estimated Models • Diagnostic Testing of Estimated Models • Model Fit • Standard Error – Adj. R squared • Constant Variance • Correlated Errors • Model Stability • Elasticities (Price, Income, Weather) • Time Series Properties of the Data • Short-run Dynamics • Long-run Relations • Integration / Cointegration
Replication of the Forecasts • Forecast Simulation • Performed simple simulation conditioned on actual explanatory variables • Long-run State Models are reasonably close • Forecast Replication is close. Still need to compare notes with ISO-NE staff • Forecasting Process and Theory • Recent Developments in Econometric and Forecasting Techniques • Archiving and Documentation Procedures
Our Replication Experience • Good news-we did it, all the data are extant, programs worked as advertised, etc. • Not so good news-couldn’t have done it without lots of help • Learned a lot about models that was not obvious from reported statistics
Recommendations • Improve Documentation • Data and Model Archiving • Seasonal Peak Models (Specification Issues) • Choice of Included Variables • Levels or Natural Logarithms • ADL Model Dynamics (Serial Correlation Correction) • Cooling Load Indexes • Load Factor • DSM Issue • Choice of Projection (Level, Continued Trend, and Smoothing)
Recommendations • Switch from Current Annual Aggregate ISO-NE Model to a Quarterly or Monthly Model. • Level of Detail • Total Load – avoid data problems in the data • Sectoral - advantage might be a gain for peak use by residential and commercial sectors • Consider the MIT Center for Energy Policy Research Center for Evaluating Actual Decision Making process regarding Capacity Expansion • New Director specializes in the techniques • Real Options approach
Are the Energy Forecasting Models Clearly Described in the Documentation? • The equations for the short and long term models are exhibited • Data sources are identified and some data series are included • The estimation results, some diagnostics and some forecast errors are reported • The general approach to merging the short and long term models is described
Assessment of ISO-NE Energy Model Documentation • In our experience ISO-NE has done more than most forecasters to document their methods and make them accessible • The content (models, data, estimation, error experience, etc.) is good • Certain transformations to splice the short and long term forecasts are not fully explained
Replication: Why is Replication Important? • Important component of scientific process. • Provide confidence in methodology. • Serve as double-check on models and data. • Starting point for further analysis and diagnostic tests. • Verification of Documentation and Archives
Replication: Why is Replication Important? • Examination of the Historical Data • Specification of the Estimated Models • Economic Theory • Statistical Theory • Time Series Properties of the Data • Diagnostic Testing of Estimated Models • Forecast Simulation • Forecasting Process and Theory