MCAS Service: Workflow-Driven Data Correlation & Analysis
Delivering software solution for data adaptation, retrieval, correlation, and display, facilitating troubleshooting, incident investigation & trend spotting in complex Grid workflows. Utilizing Mule ESB for efficient data source access and transformation scheduling.

MCAS Service: Workflow-Driven Data Correlation & Analysis
E N D
Presentation Transcript
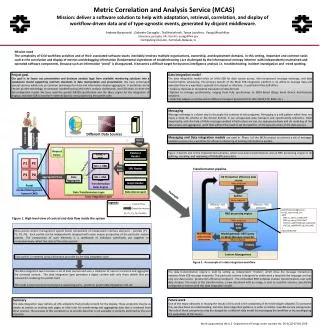
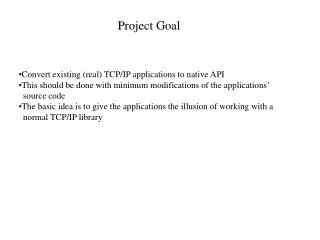
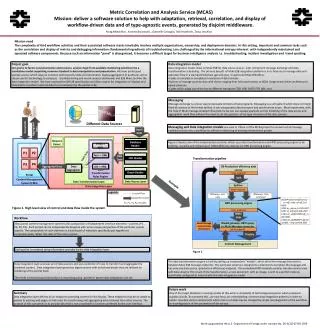
Metric Correlation and Analysis Service (MCAS) Mission: deliver a software solution to help with adaptation, retrieval, correlation, and display of workflow-driven data and of type-agnostic events, generated by disjoint middleware. Parag Mhashilkar , Andrew Baranovski , Gabrielle Garzoglio, Ted Hesselroth, Tanya Levshina Mission need The complexity of Grid workflow activities and their associated software stacks inevitably involves multiple organizations, ownership, and deployment domains. In this setting, important and common tasks such as the correlation and display of metrics and debugging information (fundamental ingredients of troubleshooting ) are challenged by the informational entropy inherent with independently maintained and operated software components. Because such an information "pond" is disorganized, it becomes a difficult target for business intelligence analysis i.e. troubleshooting, incident investigation and trend spotting. Project goal. Our goal is to factor out presentation and business analysis logic from available monitoring solutions into a standalone model supporting common standard in data manipulation and presentation. We have prototyped several services which relay on common techniques for data and information display aggregationIn particular, we’ve chosen portlet technology, to compose a troubleshooting and metric analysis dashboard, and ESB Mule, to drive the data-integration model. We have used portlet JSR128 specification and JBoss engine for integration of displays and Mule ESB to transform external data for consumption by the portlet code. • Data integration model • Data integration model relies on Mule ESB for data source access , inter component message exchange and data transformation scheduling. The primary benefit of Mule ESB integration platform is in its features to manage data and execution flow in a transport/interface agnostic way. In particular Mule ESB offers: • Codes to translate or templatise translation of data formats • Options of manage synchronicity with choice ranging from fully synchronous to SEDA ( stage event driven architecture) based solutions. • Codes which adapt out of the box to different transports (TCP, UDP, SMTP, FTP, jdbc, etc) Messaging Message exchange is a clever way to decouple contexts of two programs. Messaging is a soft pattern which does not imply fixed db schema or file format behind. It can encapsulates data transport and synchronicity issues. Most importantly, with the help of Mule message enabled infrastructure we can use opaque payloads and do modeling of the data access and aggregation work flow without the need to set the specifics of the type-structure of the data sources. Different Data Sources Aggregated Data Portal URL Messaging and Data integration models are used in Phase I of the MCAS project to connect set of message enabled services into a workflow for efficient refactoring of existing informational portals. Input Data Data Integration Layer Figure 2 depicts one of the implemented scenarios which uses data transformations and RRD processing engine to do splitting, rescaling and redrawing of D0SiteEfficiency data by the RRD processing engine. Request Parser Data Access Layer Data Transformation Layer Content Management System (CMS) Data Transformation Rules Engine Database Reader Portal HTML-> XML P1 P2 Raw Data Transformation pipeline D0 Production efficiency data source Text -> XML Apply Rules URL Reader P4 P3 Apply Rules Mule endpoint Aggregated Data Split Data Aggregator DB -> XML Graph Reader Splitter Mule endpoint Efficiency : exit code Efficiency : files produced Example Legends: Control Flow RRD processing engine ds(D0ProductionEfficiency) ec=eff_code; ef=eff_fini; RRD( CDEF:ec_adj=ec,0,100,LIMIT CDEF:ef_adj=ef,0,100,LIMIT LINE2:ec_adj#FF0000:eff_code(x100) LINE2:ef_adj#0000FF:eff_fini(x100) ) imgsize(600,300) Data/Information Mule endpoint P1, P2, P3, P4: Portlets Metadata Figure 1. High level view of control and data flow inside the system Workflow Model gateway: REST query to Mule Message convertor Mule message w/processing instructions JBoss portal content management system builds composition of independent interface elements – portlets (P1 , P2, P3, P4). Each portlet can be independently designed with some unique perspective of the particular system aspects. The composition of such elements is a dashboard of indicators specifically put together to comprehensively reflect the state of the entire system. Mule endpoint Display Content Management Each portlet is rendered using information provided by the data integration layer. Figure 2 The data transformation engine is built by setting up independent “models”, which drive the message interactions between Mule ESB message endpoints. This particular schema is designed to understand a template-like language and has only one data source (production efficiency) endpoint. The embedded RRD template enables transformations over split data streams. The result of the transformation, a new document with an image, is sent to a portlet instance, specifically configured to interact with this data integration model. Data integration layer accesses set of data sources and uses collection of rules to transform and aggregate the retrieved content. Data integration layer generates digest content with only those details that are relevant to rendering of the portlet itself. The result is returned synchronously to a requesting party,- portletor parent data integration rule set. Future work One of the major obstacles in reusing results of this work is complexity of technologies based on which proposed solution is built. To overcome this , we now focus on understanding common data integration patterns in order to isolate reusable service components which role in a model may be changed by simple rearrangement of the workflow or reconfiguration of the parameters of the service. Summary Data integration layer defines all url endpoints providing content for the display. These endpoints may be as simple as proxies to existing web pages or hide rules for transforming and aggregating data retrieved from other sources. The purpose of this complexity is to provide data that is not unavailable in contents preferred by the user interface. Work supported by the U.S. Department of Energy under contract No. DE-AC02-07CH11359