Nutrient Removal Project: Oxygen Requirements
330 likes | 690 Vues
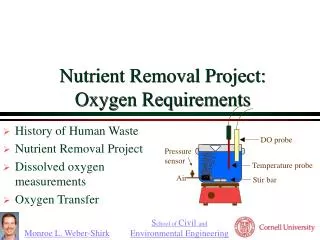
DO probe. Pressure sensor. Temperature probe. Air. Stir bar. Nutrient Removal Project: Oxygen Requirements. History of Human Waste Nutrient Removal Project Dissolved oxygen measurements Oxygen Transfer. Excreta Disposal: Land Application.

Nutrient Removal Project: Oxygen Requirements
E N D
Presentation Transcript
DO probe Pressure sensor Temperature probe Air Stir bar Nutrient Removal Project: Oxygen Requirements • History of Human Waste • Nutrient Removal Project • Dissolved oxygen measurements • Oxygen Transfer
Excreta Disposal:Land Application • When population densities were low excreta disposal was an individual problem. • As cities grew it was no longer possible for individuals to practice “direct land application.” • Before 1800 city residents placed “night soil” in buckets along streets and workers emptied the waste into “honeywagon” tanks. • The waste was transported to rural areas for disposal on farm land. The honeywagon system preserved the essential feature of land application of the waste. Nutrient Recycle
Toilets • Until about 1850 even the members of Congress were required to go outside and walk down Capitol Hill to privy facilities. • 1850-1900: The flush toilet came into general use in the U.S. during the last half of the nineteenth century. • Introduction of the toilet coincided with ______ _____. central heat
Night Soil vs. Sewers • Dutch engineer Charles Liernur advocated dry disposal. He claimed underground sewers would be the source of ________ _____ giving rise to sickness and death. • English engineer Baldwin Latham supported water carriage of excreta. Latham proceeded with the installation of a water carriage system for Croydon, where he was engineer of public works. • The water carriage system led to an immediate decrease in the death rate in the cities that installed it. noxious gases But what about the cities downstream?
Conversion of Storm Sewers to “Sanitary” Sewers • Toilets were connected to existing storm sewers • The storm drain systems discharged directly to streams, lakes, and estuaries without treatment • Treatment of wastewater only became an issue after the self-purification capacity of the receiving waters was exceeded and ________ __________ became intolerable nuisance conditions
Wastewater into Streams:Enter Environmental Engineering! • Drinking water treatment began to receive attention in the 1800s. • London, and cities on the Great Lakes found themselves draining their raw sewage into the same body of water from which they took their drinking water. • Chicago solved this problem by reversing the flow of the Chicago river and sending its waste through a canal to the Illinois River to the Mississippi. • English engineers tackled the problem by developing treatment techniques for both wastewater and drinking water.
Evolution of Treatment Goals • Solids (sedimentation) • BOD (activated sludge) • Nitrification (convert ammonia to nitrate) • Denitrification (convert nitrate to N2) • Phosphorus (get bacteria to take up phosphorus so phosphorus can be removed with the sludge)
Nutrient Removal Project • The challenge: build an automated wastewater treatment plant that removes organic carbon and (as research projects) nitrogen or phosphorus from a synthetic feed • Batch or continuous feed • Various nitrogen removal strategies • Maintain high cell concentrations using sedimentation • We need to monitor oxygen levels • We need air (oxygen)…
A Oxygen consumption: less than 10-7 grams of oxygen per hour (less than 0.1 µL of oxygen per hour) in air. 330 nanoamps typical at 37°C and 1 atmosphere in air. Oxygen permeable membrane O’ring KCl electrolyte anode cathode Oxygen Probe Signal Conditioning circuit turns A into a voltage 0.8 V Voltage source Current meter What controls the current?
Dissolved Oxygen Probe: Theory • Applied 0.8 V reduces O2 to H2O at the cathode and keeps the O2 concentration very low • The cell is separated from solution by a gas permeable membrane that allows O2 to pass through • The rate at which oxygen diffuses through the gas permeable membrane is proportional to the difference in oxygen concentration across the membrane (proportional to the oxygen concentration in the solution) • Oxygen reduction produces a current that is measured by the meter
mg/L atm K Dissolved Oxygen Probe: Calibration • Single point (linear) calibration at saturation • Saturation concentration • Temperature dependence • Atmospheric pressure dependence • Membrane temperature effect • Diffusion through membrane is a function of temperature • Linear calibration coefficient • Equation for calculating DO
What Controls Oxygen Transfer? What is C* at the bottom of a 10 m water tank? How could you change residence time? • _____________________ • _____________________ • _____________________ • _____________________ • ______________________________________ • ______________________________________ Deficit transfer coefficient Bubble surface area Bubble residence time Turbulence Bubble pressure (depth and surface tension) overall volumetric oxygen transfer coefficient
What is ? • Overall volumetric gas transfer coefficient • v is for volumetric (it is based on the volume of the reactor rather than the more fundamental and illusive quantity of the interfacial area) • l is for the liquid phase. The liquid phase transfer is the slow step in this process (gas phase transfer is very rapid) and thus liquid phase resistance completely dominates the gas transfer • A first order reaction coefficient with units of 1/t
C C* Where is the best data for calculating ? t Aeration:Initial Oxygen Deficit, No BOD Do = 5 mg/L 5 mg/L C* = oxygen concentration in equilibrium with atmosphere
Measuring the Transfer Coefficient • Specific for a particular reactor design/configuration and for a specific flow rate • We want to know how the transfer coefficient varies with flow rate (so we can estimate how much oxygen we are delivering) integrate
Aeration Methods • Diffused Aeration Systems: (compressed air pumped into aeration tanks) • Porous diffusers • Ceramic • Plastic membranes • Non-porous diffusers (hole in a pipe) • Mechanical Aeration Systems
Oxygen Transfer Efficiency (OTE) • Percentage of the mass of oxygen transferred into the water divided by the mass of oxygen supplied to the water • You will calculate OTE for your system • OTE will be less under wastewater conditions • Lower oxygen solubility (salts, organic matter) • Lower surface tension
Oxygen Transfer Efficiency: O2 dissolved / O2 delivered • How do we measure the rate that oxygen is dissolving? V is reactor volume But dC/dt varies with oxygen deficit Our goal is to measure this in lab After we have measured the transfer coefficient we can easily calculate the oxygen transfer rate Compare with supplied O2 flow rate
Air Supply Design Questions • How much oxygen will be required by the wastewater? • How much air will need to be supplied? • Number of diffusers • Reactor configuration (shallow vs. deep) • How will we supply the air? • Peristaltic pump • Laboratory compressed air (100+ kPa source) with air flow controller BOD Q*BOD Tradeoff cost and efficiency
Diffuser Air Supply Design • If we use the laboratory air supply (100 kPa) for the NRP how could we regulate air flow? • We have computer controlled solenoid valves. • Any ideas? • Easy solutions? • Great solutions? • What would you like the capabilities of this device to be? • How could you give the device the capabilities you want? Electromagnet turns on and off
Preparation for Lab • Read the section on Process Control http://ceeserver.cee.cornell.edu/mw24/cee453/NRP/default.htm (first three items under Milestones) • Come ready to play • Ask lots of questions! • Make it your goal to understand as much of the system as you can! • You will be assembling the airflow control hardware and creating the rules for the states to control the process
S1 N2 S2 7 kPa Pressure sensor (optional) Accumulator 200 kPa Pressure sensor DO probe Temperature probe (optional) Stir bar Needle Valve Solenoid Valve 1.5 mm ID x 5 cm restriction Air Supply Lab Setup
Aeration Analysis • Student data set… • Large data set • Plan how you will organize the analysis • How can you format the data so all of the data sets are addressed identically? • If you find the analysis repetitive, figure out how to program the computer to do the repetitive tasks • Eliminate the creation of equations that need to be modified many times! • Indirect addresses • Lookup tables • An empirical model for the oxygen transfer coefficient?
Indirect referencing:Calculate the Slope • Compare these two equations =-SLOPE('100'!E2:E24,'100'!A2:A24)/86400 =-SLOPE(INDIRECT("'"&F2&"'!g2:g"&(G2+1)), INDIRECT("'"&F2&"'!A2:A"&(G2+1)))/86400
Lookup Tables • Use Lookup to find the calculated oxygen transfer coefficient given a flow rate. This will be useful to plot the model reaeration. • VLOOKUP(sheet,resultstable,3) • Sheet is also the air flow rate • Resultstable is the table containing columns of air flow rates, datarows, and oxygen transfer coefficients (column 3)
NRP Context… Can you control the oxygen concentration? • Suppose that you knew the desired rate of oxygen transfer into the reactor • How would you set the air flow rate?
A model for the oxygen transfer coefficient? • Why are there diminishing returns at high flow rates? • What will happen as the flow rate continues to increase? • How would you draw a curve through the data? • What type of function might produce this behavior? • What is the transfer coefficient when the air flow rate is zero?
Review • Report guidelines • Use lab manual as a style guide • Recommend that you learn how to use Word styles • What is Excel? • Spreadsheet requirements • Why is spreadsheet technique important? • What is wrong with typing numbers into equations? • Dependency!!!!!!!!!!!!!!!!! • Ability to evaluate how changes propagate
Data Hints • What does our model describe? • Reaeration! • Therefore need to find sections of data containing reaeration! • Discard the rest • Look for any errors in the data. • One set of group data appears to have a different saturated oxygen concentration. • Challenge: Propose a way to correct that data (and correct it!). • Why might groups have different results? • How might you modify the experimental protocol to collect a better set of data • Check out how the graph contains the correct data range