Analyzing Public Transit Data in Arizona: Trends, Challenges, and Opportunities
This report presents a comprehensive analysis of public transit data, focusing on Arizona's urban transportation landscape. Utilizing aggregated data from various authoritative sources, it examines ridership, costs, revenues, and safety statistics. The findings reveal significant insights into the efficiency and equity of public transit systems, alongside the economic impacts of various transportation investments. Despite the challenges in communicating these results, the data emphasizes the critical need for improvements in public transit to enhance urban travel experiences and reduce environmental impacts.

Analyzing Public Transit Data in Arizona: Trends, Challenges, and Opportunities
E N D
Presentation Transcript
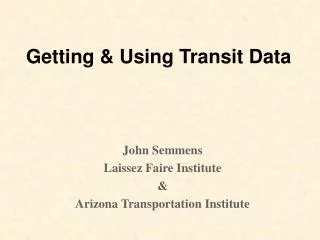
Getting & Using Transit Data John Semmens Laissez Faire Institute & Arizona Transportation Institute
Aggregated Data Sources • Public Transportation Fact Book, American Public Transportation Association (http://www.apta.com) • Highway Statistics, Federal Highway Administration (http://www.fhwa.dot.gov/policy/ohpi/hss/) • American Dream Coalition (http://americandreamcoalition.org/)
Transit Data • Ridership: Trips & Passenger-Miles • Vehicle-Miles & Hours • Costs & Revenues • Crashes & Fatalities • Crime
Highway Data • Vehicle-Miles • Costs & Revenues • Crashes & Fatalities
City-by-City Data • Transit Profiles, Federal Transit Administration (http://www.ntdprogram.com/NTD/Profiles.nsf/ProfileInformation?OpenForm&2001&All). • Section 5309 Annual Report on New Starts and Final Environmental Impact Statement, Valley Metro (www.valleymetro.org)
Local Data • Disaggregated Data • Traffic Impact • Environmental Impact
Transit's Share of Urban Travel 60% 50% 40% 30% 20% 10% 0% 1945 1950 1955 1960 1965 1970 1975 1980 1985 1990 1995 2000 2001 Year Sources: Public Transportation Fact Book and Highway Statistics
Cost Per Person-Mile of Travel Taxes Private Costs/Fares Total Roads $ 0.05 $ 0.29 $ 0.34 Buses $ 0.58 $ 0.20 $ 0.78 Light Rail $ 1.34 $ 0.14 $ 1.48 Sources: Public Transportation Fact Book,Highway Statistics and American Dream Coalition
Impacts of Alternative Investments ($ in billions) Public Transit Break-Even 5% ROI Amount Invested $370 $370 $370 Current Value of Residual Assets $19 $370 $615 Number of Jobs 1 million 19 million 32 million Source: Public Transportation Fact Book
Urban Travel Fatality Rates by Mode 1991-2001 Averages Bus Commuter Rail Heavy Rail Light Rail Urban Auto Fatalities/Billion Vehicle Miles 55 391 133 359 11 Fatalities/Billion Person-Miles 6 12 6 14 10 Sources: Public Transportation Fact Bookand Highway Statistics
2001 Public Transit Serious Crime Statistics Total Rate* Bus 5,285 240 Commuter Rail 2,768 290 Demand Response 26 30 Heavy Rail 11,849 836 Light Rail 1,528 1,063 *murder/rape/robbery/assault/larceny/theft/burglary/arson per billion passenger miles Source: Public Transportation Fact Book
Carbon Monoxide Parts/Million in Year 2020 No-Build Build Light Rail Amount Higher Under Build Option AverageOne Hour Levels 6.5 6.8 +0.3 Average Eight Hour Levels 4.6 4.8 +0.2 Source: Central Phoenix/East Valley Light Rail Project: Final Environmental Impact Statement
Impact on Daily Traffic Auto Speeds Build No Build Region 22.3 mph 22.4 mph Corridor 17.7 mph 17.9 mph Source: Central Phoenix/East Valley Light Rail Project: Final Environmental Impact Statement
Relative Performance for Phoenix Transportation Options Efficiency Equity Effectiveness Mode Cost per Rider-mile Rider share of cost Share of regional travel Light Rail $2.90 5% 0.2% Bus $1.87 15% 0.9% Road/Auto $0.35 100% 98.9% Sources: Central Phoenix/East Valley Light Rail Project, FY 2004 Section 5309 Annual Report on New Starts (Valley Metro) Regional Transportation Plan (Maricopa Association of Governments) American Dream Coalition
Summing Up • There is a lot of published data available—both national & local. • Some data are easy to get, other data require more effort. • The data tell a story of public transit inefficiency, inequity & ineffectiveness. • Getting this story out to the media and voters is difficult.