Download
1 / 13
130 likes | 150 Vues
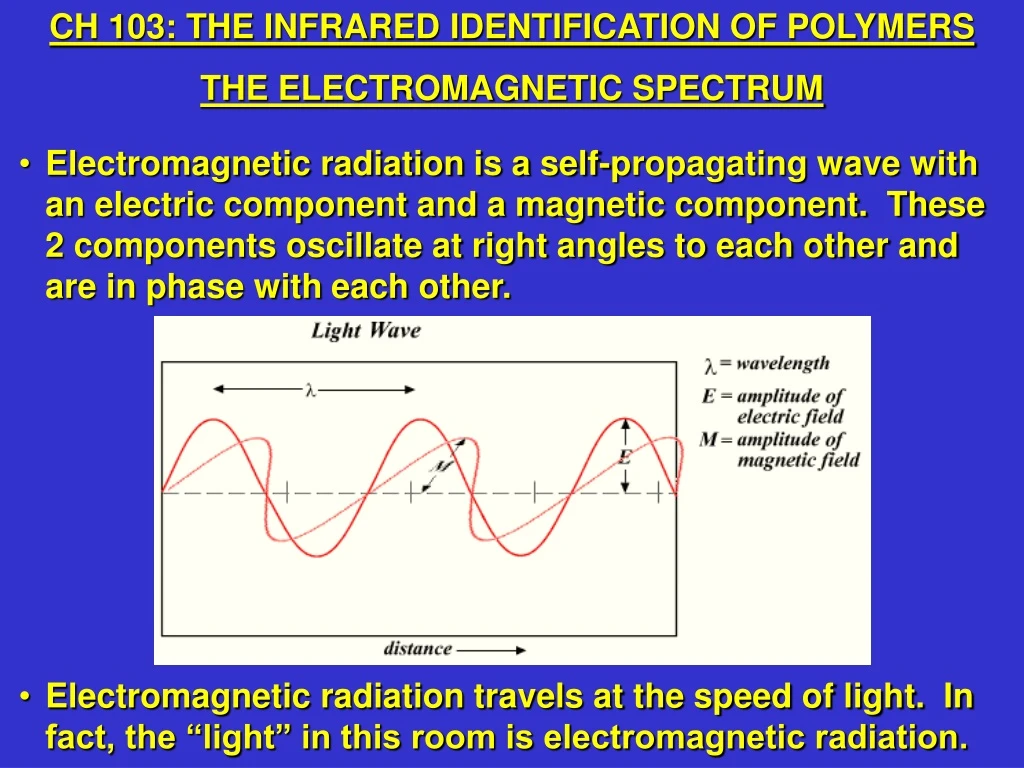
CH 103: THE INFRARED IDENTIFICATION OF POLYMERS THE ELECTROMAGNETIC SPECTRUM. Electromagnetic radiation is a self-propagating wave with an electric component and a magnetic component. These 2 components oscillate at right angles to each other and are in phase with each other.

E N D
CH 103: THE INFRARED IDENTIFICATION OF POLYMERS THE ELECTROMAGNETIC SPECTRUM • Electromagnetic radiation is a self-propagating wave with an electric component and a magnetic component. These 2 components oscillate at right angles to each other and are in phase with each other. • Electromagnetic radiation travels at the speed of light. In fact, the “light” in this room is electromagnetic radiation.
THE ELECTROMAGNETIC SPECTRUM • The wavelength (λ, the length of 1 cycle in meters) times the frequency (ν, the number of cycles per second) equals the speed of light (c, a constant that equals 3.0 x 10⁸ meters/second). That is, • c = λν = 3.0 x 10⁸ meters/second • If λ increases, then ν must so that c remains constant. • If λ decreases, then ν must so that c remains constant. decrease increase
THE ELECTROMAGNETIC SPECTRUM • Electromagnetic radiation is also a stream of energy packets called photons. • The energy of a single photon (E, in joules) equals Planck’s constant (h, 6.626 x 10⁻³⁴ joule second) times the frequency (ν, the number of cycles per second). That is, • E = hν = hc/λ • If the frequency (ν) increases, the energy (E) . • If the wavelength (λ) decreases, the energy (E) . increases increases
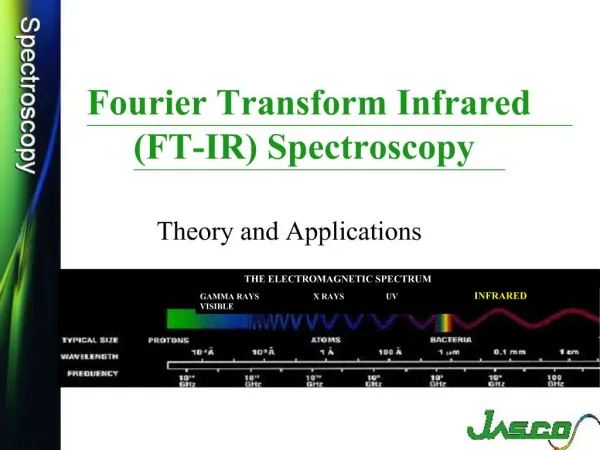
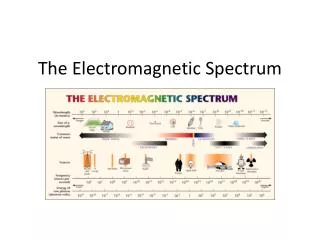
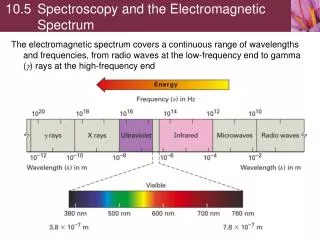
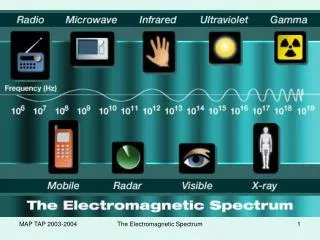
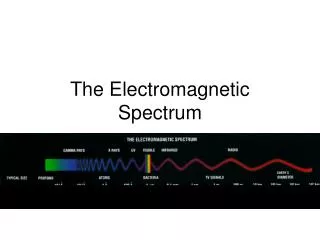
THE ELECTROMAGNETIC SPECTRUM • The ultraviolet (UV) region of the electromagnetic spectrum includes all wavelengths from 10 nanometers (nm) to 380 nm. The vacuum-ultraviolet region goes from 10 nm to 200 nm because air absorbs strongly at these wavelengths so instruments must be operated under a vacuum in this region. The near-ultraviolet region goes from 200 nm to 380 nm. • The visible (Vis) region goes from 380 nm to 780 nm and can be seen by the human eye. • The infrared (IR) region goes from 0.78 micrometers (μm) or 780 nm to 300 μm. However, the near-infrared (0.8 μm to 2.5 μm) and the NaCl-infrared regions (2.5 μm to 16 μm) are the most commonly used by analytical chemists.
THE ABSORPTION OF ELECTROMAGNETIC RADIATION BY MOLECULES • Humans see color when an object transmits or reflects visible light. • More specifically, an object may absorb specific wavelengths of electromagnetic radiation. The unabsorbed wavelengths from the visible region are transmitted and seen as color. • For example, leaves are green because the pigment chlorophyll absorbs violet, blue, and red light. • Why are violets violet? • Violets are violet because they absorb green.
THE ABSORPTION OF ELECTROMAGNETIC RADIATION BY MOLECULES • There are 3 ways that a molecule can absorb electromagnetic radiation. All 3 ways raise the molecule to a higher internal energy level. All these changes in energy are quantized; that is, they occur at discrete levels. • Rotational Transitions: The molecule rotates around various axes. Rotational transitions require the least amount of energy. Purely rotational transitions can occur in the far-infrared and microwave regions. • Vibrational Transitions: Atoms or groups of atoms within a molecule vibrate relative to each other. Vibrational transitions require an intermediate amount of energy and typically begin to occur in the mid-infrared and far-infrared regions. Therefore, as energy is increased (or wavelength is decreased) vibrational transitions occur in addition to rotational transitions. • Electronic Transitions: An electron within a molecule is typically promoted from its ground state to an excited state. Electronic transitions require the most amount of energy and typically begin to occur in the visible and ultraviolet regions. Therefore, as energy is increased (or wavelength is decreased) electronic transitions occur in addition to vibrational and rotational transitions.
CASE STUDY: IR SPECTROSCOPY AND AN OFF-COLOR ALCOHOL • A company that sells stearyl alcohol (C18H37OH) to the rubber industry received a complaint from 1 of its customers that its product was off color. The customer returned a sample of this off-color alcohol. This sample was used to identify the contaminant or contaminants that were causing this problem. • The contaminants were separated by chromatography. The separated contaminants were identified by infrared (IR) spectroscopy.
CASE STUDY: IR SPECTROSCOPY AND AN OFF-COLOR ALCOHOL • In review, IR spectroscopy measures the absorption of electromagnetic radiation caused by the vibration of atoms or groups of atoms within a molecule. Different molecules will have different IR spectra.
CASE STUDY: IR SPECTROSCOPY AND AN OFF-COLOR ALCOHOL • IR spectroscopy suggested the off-color was in part caused by long oil soya alkyd, a common ingredient in paint. • The customer was contacted and confirmed that painters worked in his plant after the alcohol was received and before the off-color was noticed. The off-color was caused by chemicals that evaporated from the paint and were absorbed by the alcohol.
TODAY’S EXPERIMENT • Work in groups of 3. • Every student in each group is assigned a different polymer (polyvinyl acetate, polyethylene, or polystyrene). • Each student uses Hyperchem to model (or predict) the infrared spectrum of their polymer. • Each student measures the infrared spectrum from 1 of 3 different samples (food wrapping, shower curtain, or yogurt cover). • Each group compares the modeled infrared spectrum from Hyperchem and the characteristic vibrational frequencies listed in the laboratory manual to these measured spectra. They will assign the different polymers (polyvinyl acetate, polyethylene, and polystyrene) to the different samples (food wrapping, shower curtain, and yogurt cover).
SOURCES • Christian, G.D. 1986. Analytical Chemistry, 3rd ed. New York, NY: John Wiley & Sons, Inc. • Harris, D.C. 1999. Quantitative Chemical Analysis, 5th ed. New York, NY: W.H. Freeman Company. • Raven, P.H., R.F. Evert, H. Curtis. 1981. Biology of Plants, 3rd ed. New York, NY: Worth Publishers, Inc. • Spencer, J.N., G.M. Bodner, L.H. Rickard. 2006. Chemistry Structure and Dynamics, 3rd ed. New York, NY: John Wiley & Sons, Inc. • Wikipedia. 2006. Image:Light-wave.png. Available: http://en.wikipedia.org/wiki/Image:Light-wave.png [accessed 2 September 2006].