APPENDIX 4
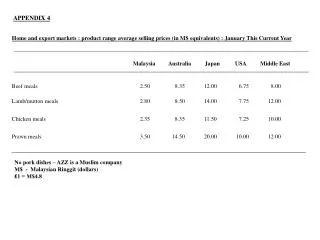
Home and export markets : product range average selling prices (in M$ equivalents) : January This Current Year. Malaysia. Australia. Japan. USA. Middle East. APPENDIX 4. Beef meals 2.50 8.35 12.00 6.75 8.00. Lamb/mutton meals 2.80 8.50 14.00 7.75 12.00.

APPENDIX 4
E N D
Presentation Transcript
Home and export markets : product range average selling prices (in M$ equivalents) : January This Current Year Malaysia Australia Japan USA Middle East APPENDIX 4 Beef meals 2.50 8.35 12.00 6.75 8.00 Lamb/mutton meals 2.80 8.50 14.00 7.75 12.00 Chicken meals 2.35 8.35 11.50 7.25 10.00 Prawn meals 3.50 14.50 20.00 10.00 12.00 No pork dishes – AZZ is a Muslim companyM$ - Malaysian Ringgit (dollars)₤1 = M$4.8
Key financial data (calendar year end) : sales revenue M$ (millions) Current Year- 5 Current Year- 1 Current Year Next Year Forecast * Current Year- 2 Current Year- 3 Current Year- 4 APPENDIX 5 Malaysia 0.3 1.1 1.9 2.7 3.8 5.3 5.6 Australia - - - - 0.2 1.0 1.9 Japan - - - 0.4 1.2 2.5 3.6 USA - - - - - 1.3 2.9 Middle East - - - - - 0.2 0.5 Total M$ (m) 0.3 1.1 1.9 3.1 5.2 10.3 14.5 M$ - Malaysian Ringgit (dollars)* = Forecast₤1 = M$4.8 (exchange rate)
Home and export net profit contribution before tax (calendar year end ; per cent) CY - 5 CY - 4 CY - 3 CY - 2 CY - 1 Current Year (CY) Next Year Forecast * Malaysia (4) 9 19 22 20 12 12 Australia - - - - (4) 4 5 Japan - - - 3 5 6 7 USA - - - - - 3 4 Middle East - - - - - 0 1 Total net profit (4) 9 19 25 21 25 29to sales (%) * = Forecast CY = Current Year Combined domestic and export business performance (calendar year end) CY - 1 CY - 2 CY - 3 CY - 5 CY - 4 Current Year (CY) Next Year Forecast * Stockturn (number of N/A 6 5 6 6 8 8times) Debtors collection period 90 95 97 109 120 128 120(days) Current ratio 1.7:1 3.1:1 3.1:1 2.3:1 1.6:1 1.6:1 2:1 Number of months in 12 8 6 5 6 7 5Overdraft (negative case flow balance) * = Forecast CY = Current Year
Options for UK market entry with weighing factor applied Criteria for evaluation(from Section 2(b)) Indirect export (2) UK salesAgent (2) UK distributor (3) Sales Subsidiary (4) Manufacture under licence (5) UK-owned manufacture (6) Joint venture (7) Acquisition (8) 1. 1 2 3 2 2 2 3 3 2. -5 2 3 4 2 4 3 3 3. 5 -3 -3 -3 -1 -5 -4 -5 4. 5 -1 -1 -4 -2 -5 -4 -5 5. 1 2 4 2 2 2 2 1 6. 5 3 3 -4 -1 -5 -3 -5 7. 5 -2 -2 -4 0 -5 -3 -5 8. -5 -1 -1 3 2 5 5 5 9. 3 3 4 -3 -4 -5 -3 -3 10. 4 -2 -2 -3 -2 -2 -3 -4 11. -5 2 3 3 3 4 4 4 12. -5 -2 -1 -1 -2 -3 2 3 13. 0 0 0 -2 -1 -5 0 -5 14. 5 2 2 -1 2 -2 -3 -4 15. -5 1 3 3 2 3 4 4 Total scores 9 12 21 -8 2 -17 0 -13 Weighing Factor (1) (2) (3) (5) (6) (7) (8) (4) 1. 3 3 6 9 6 6 6 9 9 2. 3 -15 6 9 12 6 12 9 9 3. 5 25 15 15 -15 -5 -25 -20 -25 4. 4 -20 -4 -4 -16 -8 -20 -16 -20 5. 5 5 10 20 10 10 10 10 5 6. 5 25 15 15 -20 -5 -25 -15 -25 7. 5 25 -10 -10 -20 0 -25 -15 -25 8. 3 -15 -5 -5 9 10 15 15 15 9. 4 12 12 16 -12 -16 -20 -12 -12 10. 3 12 -6 -6 -9 -6 -6 -9 -12 11. 3 -15 6 9 9 9 12 12 12 12. 5 -25 -10 -5 -5 -10 -15 10 15 13. 5 0 0 0 -10 -5 -25 0 -25 14. 5 25 10 10 -5 10 -10 -15 -20 15. 3 -15 3 9 9 6 9 12 12 Total weighted scores 27 48 82 -57 2 -107 -25 -87