Creating 3D Models for Atomic Radius, Ionization Energy, and Electronegativity Trends
30 likes | 150 Vues
In this collaborative activity, groups will create 3-dimensional models of assigned periodic trends: atomic radius, ionization energy, or electronegativity. The task involves measuring, cutting, and gluing straws to represent the trends visually on a periodic table. Each team member will have specific roles, including measuring lengths, cutting straws to size, attaching them to elements, labeling, and titling the periodic table. The 3D models will effectively illustrate how these chemical properties vary across the periodic table.

Creating 3D Models for Atomic Radius, Ionization Energy, and Electronegativity Trends
E N D
Presentation Transcript
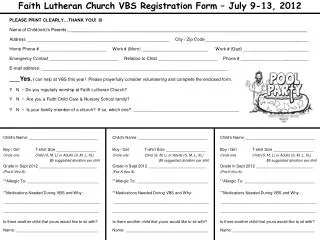
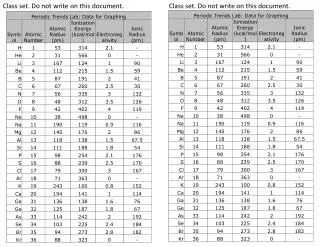
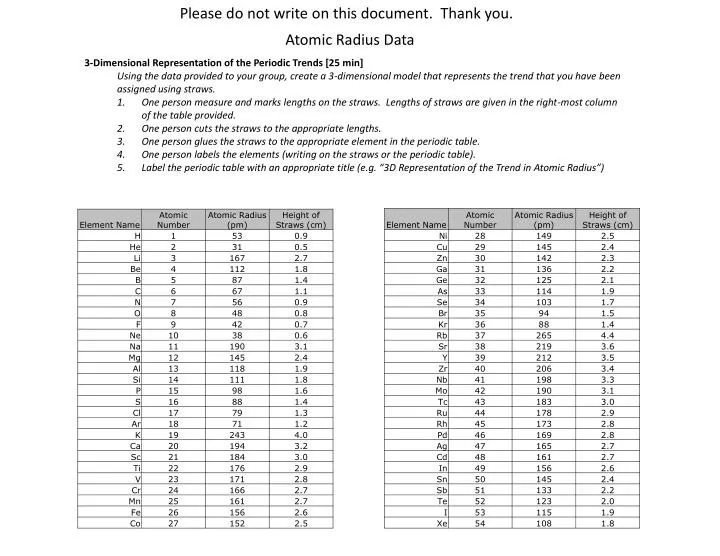
Please do not write on this document. Thank you. Atomic Radius Data • 3-Dimensional Representation of the Periodic Trends [25 min] • Using the data provided to your group, create a 3-dimensional model that represents the trend that you have been assigned using straws. • One person measure and marks lengths on the straws. Lengths of straws are given in the right-most column of the table provided. • One person cuts the straws to the appropriate lengths. • One person glues the straws to the appropriate element in the periodic table. • One person labels the elements (writing on the straws or the periodic table). • Label the periodic table with an appropriate title (e.g. “3D Representation of the Trend in Atomic Radius”)
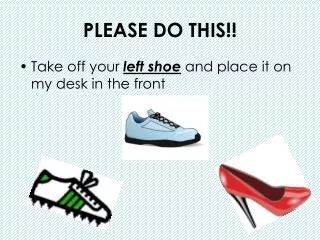
Please do not write on this document. Thank you. Ionization Energy Data • 3-Dimensional Representation of the Periodic Trends [25 min] • Using the data provided to your group, create a 3-dimensional model that represents the trend that you have been assigned using straws. • One person measure and marks lengths on the straws. Lengths of straws are given in the right-most column of the table provided. • One person cuts the straws to the appropriate lengths. • One person glues the straws to the appropriate element in the periodic table. • One person labels the elements (writing on the straws or the periodic table). • Label the periodic table with an appropriate title (e.g. “3D Representation of the Trend in Atomic Radius”)
Please do not write on this document. Thank you. Electronegativity Data • 3-Dimensional Representation of the Periodic Trends [25 min] • Using the data provided to your group, create a 3-dimensional model that represents the trend that you have been assigned using straws. • One person measure and marks lengths on the straws. Lengths of straws are given in the right-most column of the table provided. • One person cuts the straws to the appropriate lengths. • One person glues the straws to the appropriate element in the periodic table. • One person labels the elements (writing on the straws or the periodic table). • Label the periodic table with an appropriate title (e.g. “3D Representation of the Trend in Atomic Radius”)