Download
1 / 31
310 likes | 400 Vues
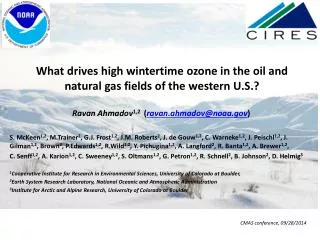
Study on factors influencing high wintertime ozone concentrations in Southwest Wyoming. Analyzes data from monitoring sites and field studies to understand the role of snow cover, mixing heights, and oil & gas activity. Uses CAMx modeling for simulations.

E N D
Simulation of Wintertime High Ozone Concentrations in Southwestern Wyoming Ralph E. Morris, Susan Kemball-Cook, Bonyoung Koo, Till Stoeckenius and Greg Yarwood ENVIRON International Corporation Novato, California 2009 CMAS Conference October 19-21, 2009 Chapel Hill, North Carolina
Increased Demand for Domestic Energy Production Wyoming Natural Gas Production: 1978-2008 Source: Wyoming Oil and Gas Conservation Commission
In 2005, WDEQ began monitoring in Jonah-Pinedale Area and found high wintertime ozone concentrations Field studies in 2007, 2008 and 2009 High Ozone in Winter in SW Wyoming Feb 3 Jonah: Feb 3, 2005
Wyoming showing Pinedale and Wind River Range Northeast of Pinedale
Southwest Wyoming Jonah Gas Field
Upper Green River Ozone Study Monitoring Sites during 2009 Field Study • Mesonet Sites • Permanent Sites (except Jonah & Boulder2) • HRA Sites
Monitored Monthly Maximum 8-Hour Ozone Upper Green Winter Peaks Upper Green Winter Peaks Upper Green Winter Peaks Upper Green Winter Peaks Upper Green Winter Peaks 2005 2006 2007 2008 2009 March
Unique Features of SWWY Ozone Episodes • Winter events • Low sun angle • Cold temperatures • Snow Cover • Rural location • Significant oil & gas development
Role of Mixing Heights SODAR Mixing Height Peak 8-Hr Avg O3 at Boulder 2008 Data • Elevated O3 when MH < 150 m AGL • Note SODAR max range = 250 m agl
UV Radiation and Snow Cover UGWOS ’07 Data 2 March: Albedo = 0.8 (snow) 23 March: Albedo = 0.06 (bare ground)
July 18 January 18 Effects of Albedo on Photolysis Rates using CMAQ JPROC Program (JPROC default Albedo = 0.05) 0.75 SWWY Albedo 6 Factor analysis 0.50 snow Albedo used in Base Case Recall Tyler Cruickshank (UDEQ/DAQ) Talk at 2008 CMAS Conference
MM5/SMOKE 36 km domain provided BCs to 12 km domain 12/4 km domains run with two-way grid nesting CAMx Modeling Domains: 2005 & 2006
Wintertime Ozone Sensitivity Tests • WDEQ field study and analysis show the following six factors are associated with high winter ozone in SWWY: • Shallow inversion (limited mixing) • White snow on ground (high albedo) • Few or no clouds • Stagnant and/or recirculating slow surface winds • Large amount of oil & gas development activity producing: • High TNMHC concentrations (e.g., ~3,000 ppbC) • High TNMHC/NOx Ratios (e.g., ~90:1 at Jonah) • Perform initial CAMx base case simulation running the model “out of the box” for the February 2006 high ozone period
CAMx Base Case – Jonah, Feb 18-28, 2006 • CAMx Base Case underestimates the February 25-27 peaks by ~30-40 ppb Feb 26 Feb 27 Feb 19 Feb 25
Account for 6 Factors for Wintertime Ozone • Shallow Inversion • Cap MM5 PBL heights in Jonah-Pinedale area on episode days to 100 m AGL • White snow on Ground • Spatially varying CAMx snow cover input file developed based on observations • Increase snow Albedo from 0.50 to 0.75 based on field study observations • Few or No Clouds • Eliminate MM5 cloud cover
Account for 6 Factors for Wintertime Ozone • Stagnant and/or Recirculating Slow Surface Winds • MM5 winds already fairly slow • High TNMHC Concentrations (several 1,000s ppbC) • High TNMHC:NOx Ratio (~90:1) • Emissions Inventory TNMHC:NOx ratio in Jonah-Pinedale area 13:1 • Field Study 6-9am measured TNMHC:NOx at Jonah averages ~90:1 on high ozone days • Multiply TNMHC emissions in Jonah-Pinedale area by factor of 3 (3xTNMHC)
Grey Line = Observed Hourly Ozone Red Line = CAMx Base Case Blue Line = CAMx 6 Factor Sensitivity Test Winter Ozone 6 Factor Sensitivity Test Results Jonah Boulder
Daily Maximum 8-Hour Ozone (ppb)February 27, 2005 Base Case 6 Factor Sensitivity Case
6-9am TNMOC Concentrations (ppbC)February 27, 2005Field Study ~1000s @ Jonah on high ozone days Base Case 6 Factor Sensitivity Case J J
6-9am TNMOC:NOx RatiosFebruary 27, 2005Field Study ~90:1 @ Jonah on high ozone days Base Case 6 Factor Sensitivity Case J J
Winter Ozone Sensitivity TestsTest Effect of Each of the 6 Factors • 6 Factor Sensitivity Test • Cap MM5 PBL depths in Jonah/Pinedale at 100 m AGL • Removed MM5 clouds from met inputs • Increase snow Albedo from 0.50 to 0.75 • 3xTNMOC emissions in Jonah/Pinedale to better match field study TNMOC concentrations and TNMOC:NOx Ratio • Sens#1: Original MM5 PBL Depths • Sens#2: Original MM5 PBL Depths and Clouds • Sens#3: Original MM5 PBL and Clouds & 0.50 Snow Albedo
February 26, 2005 100 m cap - MM5 PBL No Clouds - MM5 Clouds 3xTNMOC - 1xTNMOC 0.75 - 0.50 snow Albedo
February 27, 2005 100 m cap - MM5 PBL No Clouds - MM5 Clouds 0.75 - 0.50 snow Albedo 3xTNMOC - 1xTNMOC
Conclusions • Using MM5/CAMx “out-of-the-box” fails to produce high wintertime ozone in SWWY • With addition of the “6 Factors” CAMx able to produce high winter ozone events in SWWY • Increasing snow Albedo from 0.50 to 0.75 and increases TNMHC emissions 3x most important • 0.75 Albedo fully justified from field study • More refined wind modeling and better emissions representation may be able to produce high morning TNMHC concentrations and TNMHC:NOx ratios
Acknowledgements • The analysis of the photochemical modeling results would not have been possible without the results of the Wyoming Department of Environmental Quality (WDEQ) Air Quality Division (AQD) field study data and analysis that was conducted by the AQD and their contractors: • ENVIRON • T&B Systems • Meteorological Solutions, Inc. • Argonne National Laboratory • SWWY O&G emissions were developed by BP America and Sage Consulting, which has also been integral to this analysis