Cost estimation - Cost behavior
Cost estimation - Cost behavior. What we really want to understand is how spending will vary in a variety of decision settings. Cause-effect relations and costs drivers. Capacity and capacity costs:. Theoretical = 100,000 Practical = 90,000 Normal = 85,000 Budgeted = 80,000

Cost estimation - Cost behavior
E N D
Presentation Transcript
Cost estimation - Cost behavior What we really want to understand is how spending will vary in a variety of decision settings. Cause-effect relations and costs drivers.
Capacity and capacity costs: • Theoretical = 100,000 • Practical = 90,000 • Normal = 85,000 • Budgeted = 80,000 • Suppose fixed overhead is budgeted at $1,000,000; variable overhead is $1 per unit; direct material costs = $3; and direct labor = $3. Overhead is applied based on units of product.
What does a unit of product cost if overhead is allocated based on theoretical capacity? Capacity and capacity costs: $17 Practical capacity? $18.11 Normal capacity? $18.76 Budgeted capacity. $19.50 Which measure should the company use?
Capacity and capacity costs: Suppose the company allocates overhead based on practical capacity and actual production is 70,000 units. By how much is overhead underapplied? About $222,300 What does that cost represent? The cost of idleor excess capacity.
Capacity and capacity costs • Who should pay for excess capacity? • Who should pay for idle capacity? • How is capacity measured? What is the scarcest resource? • Idle capacity and opportunity costs.
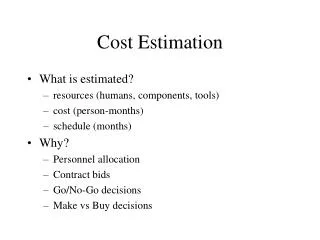
Cost estimation: overhead • When is it important to understand how overhead behaves? • When pricing, production, process and product design decisions are made. • When bids and make or buy decisions are made. • When we need to answer “what if” questions.
Cost estimation: overhead costs • First week’s product costing exercises: applied overhead. • Valuing inventories & costs of sales. • Not for costing individual products • Not for predicting costs
What methods are available? • Engineering estimates • Account analysis • Scattergraph and high-low estimates • Statistical methods (typically regression)
Cost behavior: linear function by assumption. TC = FC + VC*(level of cost driver) where TC = total cost FC = fixed cost VC = variable cost per unit of the cost driver, and sometimes the cost driver is represented by X.
A B C D
Cost estimation: Account analysis • Review each account • Identify it as fixed or variable (or mixed) • Attempt to determine the relationship between the activity of interest and the cost • Cost of building occupancy • Cost of quality inspections • Cost of materials handling
Example Suppose management believes that the monthly overhead cost ($5000) in the factory is mixed. It is believed to be 50% fixed and 50% variable. The variable portion is believe to depend on machine hours, which average 10,000 per month. How would you show this as a linear equation? TC = $2500 + $.25(machine hours) Peterson Mfg. in Problem Set #1 will require account analysis.
Scattergraph Suppose you have data on overhead costs and machine hours for the past 15 months. Can you easily determine whether the posited relationship exists? Yes, plot the data and look for a relationship.
High-Low cost estimation Find the variable cost per unit of the cost driver (VC):
High-Low cost estimation Estimate the total overhead cost during amonths when 115 machine hours will be used:
Cost estimation using regression • Y = the dependent variable (total O/H cost) • X = the explanatory variables Y = *X + where X = machine hours and = random error. TC = FC + VC*X + .
Simple linear regression • One explanatory variable • Cost estimation equation • Coefficient of correlation (R) • Coefficient of determination (R2) • Goodness of fit • Measure of importance • F-statistic (hypothesis testing) • p-value
Coefficient of determination Measures the percentage of variation in thedependent variable explained by the independentvariable. When the predicted values exactly equal theactual costs, R2 = 1. A goodness of fit test: R2 > .3
The F statistic • Goodness of fit hypothesis testing • Compute a statistic for regression results • Compute the associated p-value, or • Look up a critical F-value and compare • 1 numerator degree of freedom • (n-2) denominator degrees of freedom • alpha = .05
The F test: • The hypothesis is: The slope coefficient is zero. • The F-statistic measures the loss of fit that results when we impose the restriction that the slope coefficient is zero. • If F is large, the hypothesis is rejected.
The p-value • This is the probability that the statistic we computed could have come from the population implied by our null hypothesis. • Suppose we hypothesize that the slope coefficient is zero. • If the p-value associated with the F-statistic is small, chances are the slope coefficient is not zero.
Forecasting overhead • Predict monthly overhead when machine hours are expected to be 62 and direct materials costs are expected to be $1,900. • Recall • = $1,333.96 • Coefficient for mhrs = $4.359 • Coefficient for DM$ = $.258
Putting together a bid • Calculate a minimum bid for a contract that would use 22 machine hours and $900 in direct materials. This would be a one-time-only job. • What if there is no idle capacity? • Would your bid change if there were potential for repeated business?
Problems with regression • Nonlinear relationships • Outliers • Spurious relationships • Data problems • Inaccurate accounting cut-offs • Arbitrarily allocated costs • Missing data • Inflation
Thursday • Cenex and Burd & Fletcher Cases. • Use Excel for regression computations • We will discuss the problems in class and • Work a handout problem in groups.