Trip Distribution and Assignment
Trip Distribution and Assignment. Modeling Methods. Traffic Impact Analysis Modeling Methods. Why Most manual distribution and assignment techniques include numerous subjective inputs Models offer an MPO-adopted tool to aid in distributing and assigning traffic. Modeling Methods.

Trip Distribution and Assignment
E N D
Presentation Transcript
Trip Distribution and Assignment Modeling Methods
Traffic Impact AnalysisModeling Methods • Why • Most manual distribution and assignment techniques include numerous subjective inputs • Models offer an MPO-adopted tool to aid in distributing and assigning traffic
Modeling Methods • FSUTMS–Florida Standard Urban Transportation Model Structure • Florida’s standard model used in all 26 MPOs • FSUTMS uses Cube Voyager software engine • Effective for site impact analysis when combined with manual techniques • At a minimum, FSUTMS trip generation outputs must be verified with manual analysis (ITE)
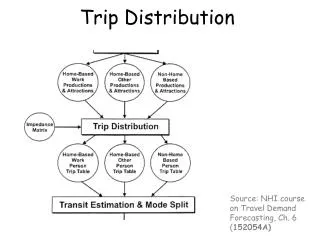
Travel Demand Modeling • Four-Step Process • Other auxiliary modules include network building and calculating zone-to-zone travel times. Trip Generation Trip Distribution Mode Split Trip Assignment
FSUTMS Trip Generation SFDUMFDUHotelEmployment 1 xxx xxx xxx xxx xxx xxx 2 xxx xxx xxx xxx xxx xxx 3 xxx xxx xxx xxx xxx xxx 4 xxx xxx xxx xxx xxx xxx ZONEDATA Special Generators 2 xxx xx xxx xx 3 xxx xx xxx xx TAZPRODSATTRS 1 xxxx xxxx 2 xxxx xxxx 3 xxxx xxxx 4 xxxx xxxx SPECGEN Generation
Trip Generation • Inputs: • Number of homes and employees (ZONEDATA file) in each traffic analysis zone (TAZ) • Outputs: • Number of Production trip ends (generated by homes) and Attraction trip ends (generated by employment sites) for each zone • Note: The model adjusts the number of A’s (usually downward) until number of P’s and A’s in the entire MPO are equal.
FSUTMS Trip Distribution Person-Trip Table T O______ 1 2 3 4 1 xx xx xx xx 2 xx xx xx xx 3 xx xx xx xx 4 xx xx xx xx F R O M__ PRODS Distribution ATTRS
Trip Distribution • Inputs: • P’s and A’s calculated in trip generation • Outputs: • The number of person-trips traveling between each zone pair in the MPO area • Production trip ends are matched up with attraction trip ends from throughout the network to form person-trips, using a gravity model.
FSUTMS Mode Split Vehicle-Trip Table T O______ 1 2 3 4 1 xx xx xx xx 2 xx xx xx xx 3 xx xx xx xx 4 xx xx xx xx F R O M__ Mode Split Person- Trip Table
FSUTMS Mode Split • Inputs: • Person-trip table from trip distribution • Outputs: • Vehicle-trip table • Vehicle occupancy factors or transit usage equations are applied to convert person-trips to vehicle-trips • Vehicle occupancies differ by trip purpose (e.g., work trips generally have fewer passengers than recreational trips).
FSUTMS Highway Assignment xxx xxx xxx xxx xxx xxx xxx xxx xxx xxx xxx xxx xxx xxx Network Link Volumes From To NodeNodeVolume 1001 1002 xxxx 1001 1003 xxxx 1002 1004 xxxx xxx xxx xxx xxx xxx xxx xxx xxx xxx xxx xxx xxx xxx xxx xxx xxx xxx xxx xxx xxx xxx xxx xxx xxx xxx Assignments Vehicle- Trip Table
Highway Assignment • Inputs: • Vehicle-trip table • Outputs: • Number of trips upon each roadway link • Vehicles are routed along specific roadways to arrive at the zone they desire to reach.
FSUTMS vs. ITE Trip GenWhich is better for Site Impact Analysis? • Intended Purpose • FSUTMS • Designed to replicate MPO areawide travel patterns • Calibration = Avg Link Volume-To-Count comparisons • NOT calibrated to zone-specific traffic volumes • ITE • Designed to find correlation between land use quantities and number of trips entering and exiting specific types of developments
FSUTMS vs. ITE Trip GenWhich is better for Site Impact Analysis? • Application • FSUTMS • Does not calculate “Trips” for employment sites. Rather, the model calculates “Attractions,” which are only measures of relative attractiveness to draw Productions to the zone. • ITE • Calculates the average number of trips generated by varying quantities of specified land uses.
So what is FSUTMS good for? • Key strengths: • Trip distribution and assignment • Non-development trips • Therefore… • The best modeling methodology for traffic impact analysis: • Uses the gravity model and capacity-restrained assignment • But, calculates the number of development trips consistent with ITE
Replicating ITE Results in FSUTMS(For the proposed development’s TAZs) • Two alternative methods: • Special Generator method • uses model’s SPECGEN input file • requires running the model and adjusting several times • Link Distribution Percentages method • uses conventional ZONEDATA input file • single model run indicates percentage of total external development traffic traveling on each link
Special Generator Method • Uses SPECGEN input file • Requires several assumptions to factor the development’s ITE-generated trips: • Vehicle-trips to person-trips (using vehicle occupancy factors) • Percent trips by purpose (work, shopping, social-recreational, non-home-based, etc) • Percent productions versus attractions Disney Logo / Arena in Miami
Special Generator Method • Requires trial-and-error attempts to match FSUTMS to ITE • Check final trip table after FSUTMS trip attraction balancing and vehicle occupancy factoring • Compare to ITE calculations • Adjust SPECGEN inputs and rerun model until traffic loadings to/from development zones match development’s ITE external trip generation
Link Distribution Percentages Method Employees per 1,000 sq ft–Typical Rates Office: 4 Industrial: 2 Hospital: 3 Warehousing: 1 Retail <200KSF: 3 Hotel: 1 per room Large-scale retail: 2 Source: ITE, ULI • Insert dwelling unit and employment estimates into conventional ZONEDATA input file • Requires converting square feet to industrial, commercial, and service employment • Execute full FSUTMS model run
Link Distribution Percentages Method • For each roadway segment, calculate development traffic percentage: Development traffic on link . Total external generation of site (modeled) = Link % • Apply ITE total external generation to link percentages • Development trips for each roadway link = • Link % x Total External ITE Generation
Link Distribution Percentages Method External ITE = 15,000 FSUTMS Output (Development Trips) 10,000 15,000 7,000 3,000 30% 70% 15,000 x 30% 4,500 15,000 x 70% 10,500 Distribution Factors (manually calculated) ITE-Generated Development Trip Loadings
Link Distribution Percentages Method Benefits • Easier application • Generally similar results as SPECGEN method • If development’s land use quantities change slightly, no need to rerun model • CAUTION: Significant land use changes may affect distribution patterns, requiring a new model run
FSUTMS Highway Assignment • Based on a capacity-restrained, equilibrium assignment routine • Capacity restraint accounts for route diversion that occurs when drivers encounter congestion • FSUTMS decreases speeds on congested roadways after each iteration of the assignment, until: • Equilibrium is achieved when all trips in the MPO area have found the least congested, shortest-time path to their destination
FSUTMS Site Impact AnalysisHIGHWAY ASSIGNMENT • Uses the Selected Zone analysis tool • Single assignment tracks total trips and development trips throughout the capacity-restrained roadway network • Background traffic = Total minus development trips
Selected Zone Analysis Procedures • Input proposed development’s land use into zonal data • Run FSUTMS • Display traffic that enters/exits development zone(s) on the loaded network using the traffic assignment path file • Save development traffic as a new link attribute for further analysis • Check for reasonableness
Using MOCFModel Output Conversion Factor • Theory behind use • Land use inputs reflect peak-season occupancy rates • Base-year traffic counts used during validation represent peak-season volumes • Therefore, traffic volumes calculated by the model reflect peak-season weekday average daily traffic (PSWADT).
MOCF • AADT needed to calculate peak hour traffic volume: • AADT x K100 = 100th Highest Hourly Volume • MOCF converts PSWADT to AADT (always reduces model output volumes) • MOCF source: Florida Traffic Information disc Peak Season Factor reports • CAUTION: Use MOCF for appropriate part of county (e.g., tourist area vs. rural); do not reduce development trips
Internal Trips & FSUTMS • . Is FSUTMS the best method for estimating the number of internal trips? • . FSUTMS is only a tool that may help in a manual determination of internal trips. Caution:Size (land area) of TAZs and length of centroid connectors are the prime determinants of intrazonal trips in FSUTMS. (Longer centroid link = more intrazonal trips.) The model does not consider whether the specific land use types in the proposed development are compatible and thus, conducive to internal trip making.
Selected Zone Versus “With & Without” • Selected Zone Analysis • Single model run with total trips and development trips • Development trips are tracked within the total trip assignment paths • Retains the capacity-restraint trip diversion that occurs in the assignment of total trips Show with Show without
Selected Zone Versus “With & Without” • “With & Without” Methodology • Two separate model runs, one with proposed development in place, the other with development’s zonal data zeroed out • Link volumes for “without” run subtracted from “with” run, yielding net impact of development on each roadway link
Selected Zone Versus “With & Without” • “With & Without” methodology presents a problem: • Equilibrium highway assignment capacity-restraint equation diverts trips, often resulting in virtually no change in traffic volumes • Developer: “So, what! Diversion occurs in the real world. I should only be required to mitigate for net impacts of the development.”
“With & Without” Method FSUTMS Total Trips (With Development) 10,000 “Net” Impact??? 50,000 45,000 10,000 FSUTMS Total Trips (Without Development) 50,000 45,000 - 48,000 -48,000 2,000 - 3,000 or Ø 0 48,000 48,000
Selected Zone Versus “With & Without” • Court’s Ruling: • DRI process requires accounting for ALL trips caused by development, NOT net impact resulting from displacing existing trips to other roadways • Rationale: if all developers used the argument that trips are diverted and net impact is negligible, no developer would be responsible for mitigation Westinghouse Gateway Communities, et al. v. Lee County Board of County Commissioners Case Nos: 90-2636DRI and 90-2638DRI, Jan 14, 1991.
“With & Without” Method FSUTMS Total Trips (With Development) 10,000 “Net” Impact??? 50,000 45,000 10,000 FSUTMS Total Trips (Without Development) 50,000 45,000 - 48,000 -48,000 2,000 - 3,000 or Ø 0 48,000 48,000 UNACCEPTABLE
Distribution/Assignment Summary • Definition: Identifying traffic volumes on each roadway link • Total traffic • Development traffic • At future analysis years • Next step after assignment: Determine if any links are: • Operating at adverse LOS AND • Carrying a significant volume of development traffic
FSUTMS Resources • www.fsutmsonline.net • Model Task Force • FSUTMS training workshops • Modeling newsletter • Documentation • Technical support