GHCN-Daily
280 likes | 466 Vues
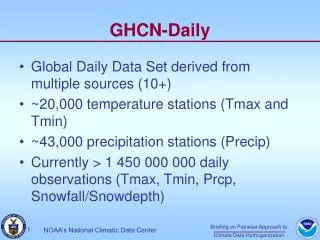
GHCN-Daily. Global Daily Data Set derived from multiple sources (10+) ~20,000 temperature stations (Tmax and Tmin) ~43,000 precipitation stations (Precip) Currently > 1 450 000 000 daily observations (Tmax, Tmin, Prcp, Snowfall/Snowdepth). Temperature Stations. Precipitation Stations.

GHCN-Daily
E N D
Presentation Transcript
GHCN-Daily • Global Daily Data Set derived from multiple sources (10+) • ~20,000 temperature stations (Tmax and Tmin) • ~43,000 precipitation stations (Precip) • Currently > 1 450 000 000 daily observations (Tmax, Tmin, Prcp, Snowfall/Snowdepth)
Updates • All sources are “refreshed” daily or weekly • Dataset is reassembled each week from original source data • QC checks are applied to full period of record
GCOS Surface Network Data • GSN Archive available from: ftp://ftp.ncdc.noaa.gov/pub/data/ghcn/daily/gsn • The GSN Archive is also integrated from a number of sources via the GHCN-Daily processing system • QC’d as part of GHCN Daily • Updated daily using GTS synoptic data and country specific sources • Still to be done: • Add “un-quarantined” data from RA I-Africa
No check has a false-positive rate of more than 20% (most <10%)—false positive rate for overall system 10% or less Total flag rate equal to 0.06% for all temperature values and 0.15% for all precipitation values Flag Rates
Pine River Dam Maximum Temperature Series minus Regional Average Undocumented Changepoint Example Version 1 Version 2
Summary of shifts in HCN mean monthly maximum and minimum temperature series. A negative shift indicates that the inhomogeneity led to a decrease in the mean level of the temperature series relative to preceding values.
Summary of shifts in HCN mean monthly maximum and minimum temperature series. A negative shift indicates that the inhomogeneity led to a decrease in the mean level of the temperature series relative to preceding values.
The Time of Observation Bias • Since the 1950s, observation times have shifted from afternoon/ evening to morning 1960s 1950s 1970s 1980s 1990s 2000- 2006 Hour of observation histograms at bottom of each U.S. decadal map (Figure courtesy of Xioamoa Lin, University of Nebraska)
Impact of Time of Observation Changes Average year by year difference over the conterminous United States between the Time of Observation Bias (TOB)-adjusted data and the unadjusted (raw) data.