INLCA-LCM_2003.ppt / 1
INLCA-LCM_2003.ppt / 1. Napa. Petaluma. Vallejo. Marin. Benicia. San Francisco. Berkeley. San Jose. Introduction to Petaluma. Located 40 miles north of San Francisco Population = 55,000 ® 70,650 Current WWTP consists of facilities constructed in 1930s and 1960s.

INLCA-LCM_2003.ppt / 1
E N D
Presentation Transcript
Napa Petaluma Vallejo Marin Benicia San Francisco Berkeley San Jose Introduction to Petaluma • Located 40 miles north of San Francisco • Population = 55,000® 70,650 • Current WWTP consists of facilities constructed in 1930s and 1960s
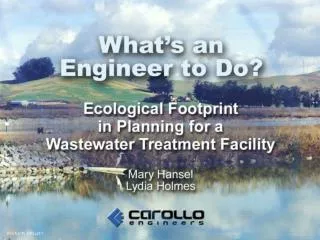
Petaluma WWTP Project Goals “develop an economically and ecologically sustainable water recycling facility” “serves as an amenity to the community by providing educational and recreational opportunities”
Treatment Alternatives Evaluated • Five treatment alternatives • All include using existing oxidation ponds ®produce algae • All include filtration/ disinfection for reuse • Subalternatives • Algae removal • Disinfection
The Dilemma “How do I assess relative ecological impacts of different alternatives within my limited budget?” INLCA-LCM_2003.ppt/6
Amount of land and water (area of the earth) required to produce all the resources we consume and to absorb all the wastes we produce The Ecological Footprint “Aha! I’ll use the Ecological Footprint!” INLCA-LCM_2003.ppt/7
Ecological Footprint Who Acres/Person What we Have World 4.7 What we Use World 5.6 U.S. 24 China 3.9
Calculating the Footprint • Scope, Boundaries & Assumptions • Identify material & and energy use • Determine quantities • Weight of materials • Amount of earth cut and fill • Delivery trips • Find conversion factors • Spreadsheet
Scope,Boundaries,andAssumptions • Five Secondary Treatment Processes • UV vs. Hypochlorite Disinfection • Wetlands vs. DAF for Algae Removal • End of life activities not considered • Land Conversion not considered • Life of facility = 40 years
Identify Material and Energy Use • Construction Materials: Concrete (CY) and Steel (Tons) • Chemicals to Operate (Tons) • Energy to Operate (kWh) • Energy to Construct (Barrels of Oil) • Emissions: Methane and Carbon Dioxide (Tons)
Conversion Factors / Calculation lbs. X kWh/lb. X acres/kWh = global acres Who Source Material Quantity Carollo Cost Estimate Embodied Energy Carollo / RP Vendor, Reports per Unit of Material Acres per Unit RP / of Energy Footprint Network
Ecological Footprint (with Methane Emissions)(global acres, not acres/year)
Ecological Footprint for UV vs. Hypochlorite Disinfection CA Power Green Power Hypochlorite (1) Materials ® 30 gac 30 gac Chemicals ® 121 gac 121 gac Power ® 10 gac 0 gac Total 161 gac 151 gac UV (1) Materials ® 6 gac 6 gac Equipment ® 6 gac 6 gac Power ® 150 gac 2 gac Total162 gac 14 gac (1) 4 mgd Urban Recycle Water System Only (Title 22) Construction energy negligible
Petaluma WRF INLCA-LCM_2003.ppt/17
Food Housing Transportation Goods Services WWTP Sonoma County Ecological Footprint 1999 0.006 2.994 5.400 5.500 4.400 4.000
How Much Did this Analysis Cost? • Consultant = $5,000 • 100 in house hours
We Learned • Moving dirt takes a LOT of energy • Land based systems not necessarily better due to methane emissions • Green energy makes a huge difference • The more you learn, the less you know!
We Learned • Data availability is a problem • Ours • In study phase, quantity estimates are not very accurate • Vendors • Weight / composition of equipment • Embodied energy of equipment • Conversion factors • How to quantify land conversion from agricultural to wetland?
We Learned • Doesn’t cover everything • Radioactive materials, heavy metals, persistent organic toxins, bio-hazardous wastes • Water quality differences not measured
Strengths of the Ecological Footprint • Can assess relative ecological impacts of alternatives • Excellent visual tool to reveal the impacts of facilities • Makes carrying capacity real • Would work well in Pre-Design for materials selection
Conclusions • Increase LCA thinking in engineers • As a first exercise, very informative • Would like to test conclusions with actual construction data & against another LCIA tool
For Footprint Inquires: • Mathis Wackernagel, Ph.D. • mathis@footprintnetwork.org • Mary Hansel, CPA • mhansel@carollo.com

![Division of Revenue Bill [B9-2003] 10 March 2003 Select Committee of Finance](https://cdn3.slideserve.com/5523624/slide1-dt.jpg)