Introduction to Nested Designs
Introduction to Nested Designs. Mark S. Rusco f or ASQ – Grand Rapids Section. Definition. A type of Designed Experiment You identify possible sources of variation Assigns values to sources of variation You work on the biggest source. Example 1.

Introduction to Nested Designs
E N D
Presentation Transcript
Introduction to Nested Designs Mark S. Rusco for ASQ – Grand Rapids Section
Definition • A type of Designed Experiment • You identify possible sources of variation • Assigns values to sources of variation • You work on the biggest source
Example 1 • (Barker) Coal is loaded from a strip mine into train cars. If the sulfur content is <5% it can be burned. Three hopper cars are sampled four times each and each sample is tested twice. How much variability is from car-to-car variation? Sample to sample? Test-to-test?
Example 2 • (Montgomery) Raw materials are purchased from three suppliers and there is too much variability in the finished product. Each supplier is sampled four times and each sample is tested three times. Is the variability between suppliers? Between batches? Between tests?
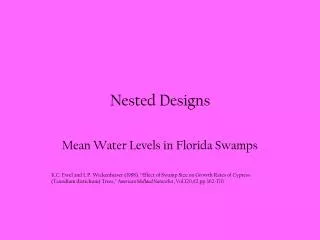
Example 3 • (Box, Hunter, Hunter) Paint pigment paste is produced in 80 drum batches. Moisture content is important, but varies widely. Fifteen batches were sampled twice each and each sample was tested twice. Is the variability between batches? Between samples? Between tests?
Total Variation about the Process Mean Sampling Variation Measurement Error Paint Paste Example Illustration The measurement value that you write down. • Standard deviation for each curve? Process Mean Batch Mean Variation of all of the batch means around the long term process mean. Variation of the drums means around the batch mean. Variation of the tests around the mean for that sample of material.
Nested vs. Crossed Designs • This is a choice for many GRR software packages. • Which do you choose? • In a Crossed Design it is possible for the different levels to participate in all of the other levels. • In a Nested Design each level cannot participate in all of the other levels. • Crossed Designs can test for interactions. • Nested Designs cannot test for interactions.
Example 1 • A typical Gauge R&R is performed using a 1” micrometer. Ten parts are selected, and 3 well-trained operators measure each part 3 times. The GRR is performed at a single location and all operators are available on the same shift. • Crossed or Nested? (crossed)
Example 2 • Two locations of a company produce mating parts that come together to provide a sliding fit in use. Each location sends 10 of their parts to the other location where they are matched to parts and tested for effort of sliding fit. Each location uses their tensile tester (same brand) with 2 operators, 10 parts, 3 trials. • Crossed or Nested? (nested)
Example 3 • You produce a part made from platinum which is supplied to you in very small batches. You have two machines set up to run the part, you clean one machine while you run the other so a batch is run completely on one machine. You want to test for variation from machine, batch, operator, and measurement. • Crossed or Nested? (nested)
Overall Steps • Recognize a situation as a possible Nested Design. • Collect and organize the data. • Calculate the Sum of Squares (SS) for each level in the hierarchy. • Create an ANOVA table to calculate Mean Square (i.e., Variance) for each source. • Create an Estimated Mean Square table and the set of equations to reflect the nesting. • Solve 4 and 5 for the Variance for each source.
Master Equation for SS • ∑(x2)/n in x – (∑x)2/n in x • x is the measured values. • At the lowest level it is the individual value • At higher levels it is a sum. • n is the number of values that went into each x and usually differs. • Example on next page.
Interpret • Batch to batch variation is the biggest contributor. Work with the supplier to minimize variation. • Machine to machine variation is next largest. Settle on one machine to run the parts. • No need to write up any operators.