Download
1 / 13
130 likes | 269 Vues
Geology 351 - Geomath. More about exponentials and logarithms. Segment II. tom.h.wilson wilson@geo.wvu.edu. Department of Geology and Geography West Virginia University Morgantown, WV. Review.

E N D
Geology 351 - Geomath More about exponentials and logarithms Segment II tom.h.wilson wilson@geo.wvu.edu Department of Geology and Geography West Virginia University Morgantown, WV Tom Wilson, Department of Geology and Geography
Review In our first lecture we discussed age/thickness relationships. Initially we assumed that the length of time represented by a certain thickness of a rock unit, was a constant for all depths. However, we noted that as a layer of sediment is buried it will be compacted. Water will be squeezed out of pore spaces, the porosity will decrease, and the grains themselves may be deformed through the process of fracturing or pressure solution. We realized that the age relationship for a certain thickness of rock could not be constant, but must vary in a more complicated way as a function of the depth of burial. Tom Wilson, Department of Geology and Geography
Recall the following data from Waltham - Over the range of depth 0-4 km, the porosity decreases from 60% to 3.75%! Tom Wilson, Department of Geology and Geography
The relationship is non-linear. A straight line does a poor job of passing through the data points. The slope (gradient or rate of change) decreases with increased depth. Waltham generated this data using the following relationship. Tom Wilson, Department of Geology and Geography
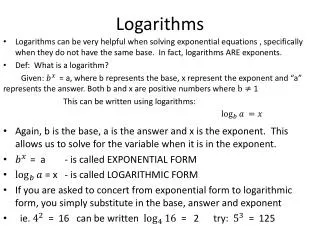
assumes that the initial porosity (0.6) decreases by 1/2 from one kilometer of depth to the next. Thus the porosity () at 1 kilometer is 2-1 or 1/2 that at the surface (i.e. 0.3), (2)=1/2 of (1)=0.15 (I.e. =0.6 x 2-2 or 1/4th of the initial porosity of 0.6. Equations of the type Are referred to as _________ growth laws or exponential functions. allometric Tom Wilson, Department of Geology and Geography
The porosity-depth relationship is often stated using the natural base e, where e equals 2.71828 .. In the geologic literature you will often see the porosity depth relationship written as 0 is the initial porosity, c is a compaction factor and z - the depth. Sometimes you will see such exponential functions written as In both cases, e=exp=2.71828 Tom Wilson, Department of Geology and Geography
Waltham writes the porosity-depth relationship as Note that since z has units of kilometers (km) that c (in the previous equation) will have units of km -1 and , units of km. Also recall that when z=, Hence, represents the depth at which the porosity drops to 1/e or 0.368 of its initial value. In the form c is the reciprocal of that depth. Tom Wilson, Department of Geology and Geography
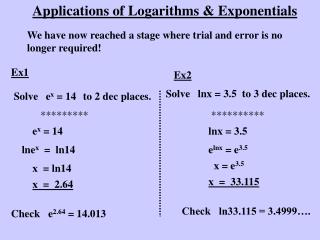
Can you evaluate the natural log of Tom Wilson, Department of Geology and Geography
is a straight line. Power law relationships end up being straight lines when the log of the relationships is taken. In our next computer lab we’ll determine the coefficients c (or ) and ln(0) that define the straight line relationship above between ln() and z. We will also estimate power law and general polynomial interrelationships using PsiPlot. Tom Wilson, Department of Geology and Geography
Logs and power laws in earthquake seismology Gutenberg-Richter Frequency Magnitude Relationship I. Seismic moment - M where r is the characteristic linear dimension of the fault II. Moment-magnitude relationship III. where c is often 1.5 Tom Wilson, Department of Geology and Geography
Mathematical Manipulation Substitute into Solve for m Substitute expression for m into and solve for N Tom Wilson, Department of Geology and Geography
We get but note that Where this area is representative of the area across which the displacement occurred and we end up with Tom Wilson, Department of Geology and Geography
For Tuesday - Complete problems 3.10 and 3.11 Hand in Tuesday Feb 23rd Tom Wilson, Department of Geology and Geography