Nature of Estimation
390 likes | 408 Vues
Learn about point estimates in statistics through examples of rolling a die, including mean, variance, and proportion estimations. Explore concepts of unbiased estimators and variability in the context of sampling distributions.

Nature of Estimation
E N D
Presentation Transcript
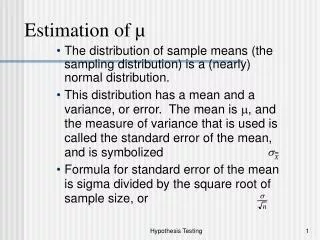
Point Estimate– a single number designed to estimate a quantitative parameter of a population, usually the value of the corresponding statistic. Examples: a. A sample mean is the point estimate for the population mean. b. A sample variance is the pt. estimate for the population variance. Values from a SAMPLE.
Now do the following…. • Consider repeating the following process: Roll a die 5 times and find the mean • Continue to do this for a VERY LARGE number of samples. • Notice the behavior of all sample means that are generated as the process continues to 10,000 trials.
Notice the mean of all of the 10,000 samples is 3.49 (very close to 3.5) and the shape of the sampling distribution is approximately normal.
Example 2…. • Find the population variance of rolling a die 5 times.
Now do the following…. • Consider repeating the following process: Roll a die 5 times and find the sample variance • Continue to do this for a VERY LARGE number of samples. • Notice the behavior of all sample variances that are generated as the process continues to 10,000 trials.
Notice the variance of all of the 10,000 samples is 2.88 (very close to 2.9) and the shape of the sampling distribution is skewed to the right.
Example 3… • Find the population proportion of rolling a die and landing on an odd number. • Because the values of 1, 2, 3, 4, 5, 6 are all equally likely, the proportion of odd numbers in the population is 0.5.
Now do the following…. • Consider repeating the following process: Roll a die 5 times and find the proportion of odd numbers. • Continue to do this for a VERY LARGE number of samples. • Notice the behavior of all sample proportions that are generated as the process continues to 10,000 trials.
Notice the proportion of all of the 10,000 samples is 0.50 (exactly the same as the population proportion) and the shape of the sampling distribution is approx normal.
In General, the mean of the population = mean of the sample and the shape of the sample is approx normal.
In General, the population variance = the sample variance and the shape of the sampling distribution is skewed.
In General, the population proportion = the sample proportion and the shape of the sampling distribution is approx normal.
Unbiased Estimators… • The preceding 3 examples show that the sample means, variances, and proportions tend to target the corresponding population parameters. • We call these 3 statistics unbiased estimators. • In other words, their sampling distributions have a mean that is equal to the mean of the corresponding population parameters.
If we want to use a sample statistic (such as a sample proportion) to estimate a population parameter (such as the population proportion), it is important that the sample statistic used as the estimator targets the population parameter. • Using a biased estimator might underestimate or overestimate the population parameter.
A good sample should be less variable and unbiased. • Variability – measured by the standard error of the mean, which requires a larger sample. (Bigger sample size, smaller variation)
UNBIASED ESTIMATORS: Can be called point estimates. • These target the population parameters.
BIASED ESTIMATORS: • These do NOT target the population parameter. • NOTE: The bias is relatively small when using s, therefore, it is sometimes used to estimate the standard deviation of the population.
Price is Right – Range Game • Credit for the idea of the Price is Right clip goes to Summer Abney, our fellow reader. • Watch the clip of the Price Is Right Range Game on you tube. • Students watch the directions for the game. Pause video. • What should the strategy be? • Watch conclusion of clip. • https://www.youtube.com/watch?v=00a4pPyIwes
Important Points……. • Sampling mean is unbiased since it equals the population mean. • Each individual sample may not equal the population mean, but it should be close. • When we say 95% of the data is within 2 st. deviations we mean 95% of data values are .
Speaking specifically about the mean….. • When speaking of samples we mean that 95% of the intervals captured will contain the population mean.
Definitions……. • Interval Estimate – An interval bounded by two values & used to estimate the value of a population parameter. Statisticians prefer to use an interval estimate rather than a point estimate. • Level of Confidence –( ); the proportion of all interval estimates that involve the parameter being estimated. • Confidence Interval – An interval estimate with a specified level of confidence.
What does the answer mean? • If the answer of a confidence interval is (918.23, 930.23), and the confidence level was 95%, then it means that I captured the population mean of the samples 95% of the time.
EXAMPLE • The next figure shows typical confidence intervals resulting from 20 different samples. With 95% confidence, we expect that 19 out of 20 samples should result in confidence intervals that contain the true value of p=0.75.
1 Confidence Interval did NOT have the predicted proportion. Therefore, 19 out or 20 did.
Remember….. • Sample measures are called statistics. • Population measures are called parameters.
Find a point estimate for a. The mean b. Variance c. St. Deviation Using 6, 8, 12, 16, 18, 21, 22, 25, 28, 29……. Use the correct symbols!!!!!
Confidence Interval for the Mean – Pop. St. Dev. KNOWN Z-Interval
Z Confidence Interval…… • Use When: a. Sampling Distribution is normal OR b. Population standard deviation is known OR the sample size is greater than or equal to 30. ( )
Definition…… • Confidence Level: the probability that the interval estimate will contain the parameter. • The most common levels of confidence are: 90%, 95%, 99%
Alpha ( )…… • Alpha ( ) = the total area in both tails. • Alpha/2 ( ) = the total area in one tail. • Example: Confidence Level = 90% = 1 - .90 = .10 = .10/2 = 0.05
Example…… • The president of a university wants to estimate the average age of students. It is known that the standard deviation is 2 years. A sample of 50 is selected and the mean age is found to be 23.2 years. Find the 95% confidence interval.
This is what the distribution looks like with a 95% confidence level. Remember: Answer……
What does this answer mean?...... • “We can say with 95% confidence that the average age of students at the university is between 22.65 years and 23.75 years.” • Note: A 95% confidence interval would be a wider interval than a 90% confidence interval. Why do you think this is?
Example…… • A certain medication increases the pulse rate. The variance is 25 beats/minute. A sample of 30 users has an average rate of 104 beats/minute. Find the 99% confidence interval.
Values: Answer……
Example…… • A sample of 50 days showed a store served an average of 182 customers. The standard deviation was 8. Find the 90% confidence interval.
Values: Answer……