Ch6: Continuous Distributions
27 Sep 2011 BUSI275 Dr. Sean Ho. Ch6: Continuous Distributions. HW3 due Thu 10pm Download and open: 06-Normal.xls. Outline for today. Hypergeometric distribution: HYPGEOMDIST() Normal distribution NORMDIST() Cumulative normal Continuity correction Standard normal

Ch6: Continuous Distributions
E N D
Presentation Transcript
27 Sep 2011 BUSI275 Dr. Sean Ho Ch6: Continuous Distributions • HW3 due Thu 10pm • Download and open:06-Normal.xls
BUSI275: Continuous distributions Outline for today Hypergeometric distribution: HYPGEOMDIST() Normal distribution NORMDIST() Cumulative normal Continuity correction Standard normal Uniform distribution μ and σ Exponential distribution: EXPONDIST() Density and cumulative
BUSI275: Continuous distributions Hypergeometric distribution ntrials taken from a finite population of size N Trials are drawn without replacement:the trials are not independent of each other Probabilities change with each trial Given that there are X successes in the larger population of size N, what is the chance of finding exactly x successes in these n trials?
BUSI275: Continuous distributions Hypergeometric: example In a batch of 10lightbulbs, 4 are defective. If we select3 bulbs from that batch, what is the probability that 2 out of the 3 are defective? Population: N=10, X=4 Sample (trials): n=3, x=2 In Excel: HYPGEOMDIST(x, n, X, N) HYPGEOMDIST(2, 3, 4, 10) → 30%
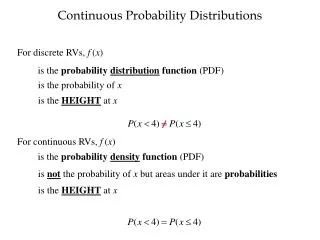
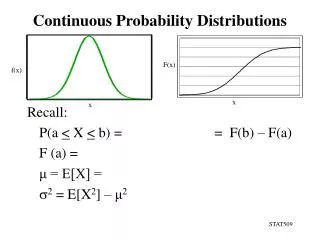
BUSI275: Continuous distributions Normal distribution The normal “bell” curve has a formal definition: Mean is μ, standard deviation is σ Drops exponentially with z-score Normalized so total area under curve is 1 Excel: NORMDIST(x, μ, σ, cum) e.g., exam has μ=70, σ=10.What is probability of getting a 65? =NORMDIST(65, 70, 10, 0) → 3.52%
BUSI275: Continuous distributions Cumulative normal Usually, we are interested in the probability over a range of values: Area of a region under the normal curve The cumulative normal gives area under the normal curve, to the left of a threshold: e.g., exam with μ=70, σ=10.What is probability of getting below65? =NORMDIST(65, 70, 10, 1) → 30.85% e.g., getting between75 and 90? =NORMDIST(90, 70, 10, 1) –NORMDIST(75, 70, 10, 1) → 28.58%
BUSI275: Continuous distributions Inverse function Excel can also find the threshold (x) that matches a given cumulative normal probability: NORMINV(area, μ, σ) E.g., assume air fares for a certain itinerary are normally distrib with σ=$50 but unknownμ.The 90th percentile fare is at $630.What is the mean air fare? We have: NORMINV(.90, μ, 50) = 630, so =630 – NORMINV(.90, 0, 50) → μ=$565.92
BUSI275: Continuous distributions Continuity correction For discrete variables(e.g., integer-valued): e.g., # of studentsper class, assumed to be normally distributed with μ=25, σ=10 The range can be inclusive or exclusive: Probability of a class having fewer than 10? <10: excludes 10 At least 30 students? ≥30: includes 30 Edge of the bar is at ±0.5 from the centre <10: =NORMDIST(9.5, 25, 10, 1) → 6.06% ≥30: =1-NORMDIST(29.5, 25, 10, 1) → 32.6% 72.5
BUSI275: Continuous distributions Standard normal There is a whole family of normal distributions, with varying means and standard deviations The standard normal is the one that hasμ=0, σ=1 This means z-scores and x-values are the same! In Excel: NORMSDIST(x) (cumulative only) andNORMSINV(area)
BUSI275: Continuous distributions Uniform distribution With a uniform distribution,all values within a range are equally likely e.g., roll of a fair die:{1,2,3,4,5,6} all have probability of 1/6 Range is from a to b: μ=(a+b)/2, σ=√( (b-a)2/12 )
BUSI275: Continuous distributions Exponential distribution Time between occurrences of an event e.g., time between two security breaches Exponential density: probability that the time between occurrences is exactlyx is: 1/λ = mean timebetweenoccurrences Need both x, λ > 0 EXPONDIST(x, λ, cum) Density: cum=0
BUSI275: Continuous distributions Exponential probability Exponential probability (cumulative distribution) is the probability that the time between occurrences is less thanx: Excel: EXPONDIST(x, λ, 1) e.g., average time between purchases is 10min.What is the probability that two purchases are made less than 5min apart? EXPONDIST(5, 1/10, 1) → 39.35% Don't forget to convert from 1/λ to λ
BUSI275: Continuous distributions REB forms Any research involving human subjects requires approval by TWU's Research Ethics Board Use of existing public data (e.g., StatCan) does not require REB approval, however: For class purposes, I will still require you to complete an REB form Forms are on TWU's REB page Bottom of page: “Request for Ethical Review” or “Analysis of Existing Data” Upload to myCourses by 11Oct For non-public data, submit signed paper copy to me by 11Oct
BUSI275: Continuous distributions TODO HW3 (ch3-4): due Thu at 10pm Remember to format as a document! HWs are to be individual work Dataset description due next week! Tue 4 Oct