Download
1 / 32
340 likes | 618 Vues
Aerosol Impacts on Climate. Climate Fellows Workshop Using Technology to Promote Climate Literacy North Carolina Botanical Gardens Chapel Hill NC June 21 2011 Uma Shankar UNC–Institute for the Environment. Outline. What are atmospheric aerosols? What are their major sources?

E N D
Aerosol Impacts on Climate Climate Fellows Workshop Using Technology to Promote Climate Literacy North Carolina Botanical Gardens Chapel Hill NC June 21 2011 Uma Shankar UNC–Institute for the Environment
Outline What are atmospheric aerosols? What are their major sources? What are their physical, chemical and optical properties? How do they affect climate – what is the whitehouse effect? What regions of the world are most affected? What do we do?
So what do aerosols look like?The view from close up… • Ionic map of atmospheric sulfate (green) and methane sulfonate (blue) particles that would be typical of a marine environment
…and from far away Haze from particulate pollution off the coast of the eastern United States, August 6, 2007 Haze over the Himalayas, Jan 17, 2007 Dust storm over the Persian Gulf on March 7, 2007
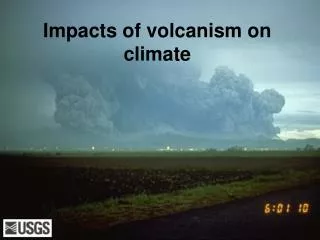
Major Aerosol Sources: Natural Volcanic eruptions Terpenes from pine, isoprene from oak oxidize to form secondary organic aerosol (SOA) Sea spray (Na, Cl, S) Wind-blown dust
Major Aerosol Sources: Man-made Auto exhaust (NOx, soot) Power plants (SOx) Oil refineries (VOCs) Human-caused forest fires and, yes, even rural cookstoves (organic and black carbon)
Aerosol Size Distributions Accumulation mode is most important for scattering sunlight in the UV-to-visible wavelengths, and for formation of cloud droplets Coarse Accumulation Aitken
Processes Affecting Aerosol Physical Properties Coagulation Nucleation Condensation and evaporation of volatile species on/off particle surface Dry deposition (including gravitational settling) Cloud processes (including precipitation) Direct emissions
Atmospheric Chemical Reactions • Emissions of SO2 undergo oxidation by OH radical and combine with water vapor to form H2SO4 particles (binary nucleation) • If NH3 is present it condenses on particles to neutralize H2SO4 to varying degrees of neutralization • Any HNO3 present (terminal product of photochemical NOx reaction cycle) will also condense on neutralized sulfate to form NH4NO3 • In marine environments reactions of Na and Cl with these constituents also occur • Secondary organic aerosols (SOA) form a vast array of species by oxidation of VOC aerosol precursors • Olefins, alkanes, alkenes, monoterpenes, sesquiterpene, isoprene… • Typically oxidants are OH-, NO3- and O3 • inorganic aerosol can mediate formation of some SOA (oligamers)
Direct Radiative Impacts • Aerosols directly attenuate solar radiation in the short and visible wavelengths • Direct scattering of solar radiation cools the earth’s surface • Known as the direct radiative forcing of aerosols
Radiative Transfer – Beer’s Law Radiation incident on an infinitesimal atmospheric layer of thickness dz dIl= -Il Kl N s ds Il= initial intensity of a monochromatic beam Kl= scattering or absorption (or extinction) efficiency (unitless) s = areal cross-section of particle or molecule (m2) N = number concentration (m-3) Integrating over the depth of the atmosphere, we get Il = IlTl, where transmissivityTl= e-tlsecq, and tl= zKl N s dz is the normal optical depth Il dz ds = dz sec q Attenuated beam Il - dIl
Radiative Transfer (cont’d) • In the absence of scattering the absorptivity is: al = 1- Tl = 1- e-tlsecq • The contributions of various substances to the respective efficiencies are additive, as are the contributions of scattering and absorption efficiencies to total extinction, i.e., KlN s = (Kl)1 N1s1 + (Kl)2 N2s2 + … Kl(extinction) = Kl(scattering) + Kl(absorption) • Can calculate Kl for aerosols based onmodels of scattering by a sphere of radius r • Kl is a function of size parameter x = 2pr / l andthecomplex refractive index m = mr + imi • mr represents the scattering and mi the absorbing component • Mie theory covers .1 ≤ x ≤ 50 (atmospheric aerosol sizes)
Indirect Radiative Impacts • Aerosols activate as Cloud Condensation Nuclei (CCN), given the proper conditions of atmospheric saturation, particle solubility (or wettability), and size • CCN increase the number of cloud droplets, increasing cloud cover, and BRIGHTNESS, i.e., the scattering of sunlight back to the atmosphere • The whiter atmosphere is visible from space (sometimes called the ‘whitehouse’ effect) • Known as the First Indirect Effect • Pollutants in cloud droplets reduce the droplet size, and activated droplets do not grow to rain drop size, increasing cloud LIFETIME • Known as the Second Indirect Effect • Semi-direct effect (heating or cooling) of Black Carbon (BC) • Absorbing aerosol; below cloud layer can heat the air, reduce relative humidity and decrease low-lying cloud cover • Above cloud layer BC can reduce the magnitude of this heating
Climate Impacts BC emis. (contained combustion) SO4 emis. BC emis. (open combustion) RF (BC+SO4) • Tropical troposphere feels greatest impact of Atmospheric Brown Clouds (ABCs) • Mixture of SO4, NO3, BC, OC, dust, etc. that forms haze layer • Mostly wash out in extra-tropical troposphere
Climate Impacts (cont’d) • ABCs inhibit vertical transport of moisture • Increase humidity above surface • Inhibit surface evaporation • Have reversed the large-scale circulation, which lofts warm, humid air north of equator and causes subsidence south of equator and brings rainfall to Northern China and Ganges valley • Projected to cause increased droughts in these regions • Increased flooding expected in Yangtze Valley • Persistent, produce a positive feedback loop • Threaten food and water security in the most populous parts of the globe
In the grand scheme of things • Radiative “forcing” of aerosols on climate has very large uncertainties, making climate change prediction very difficult
Concluding Remarks Aerosols have clearly had an impact on the global radiation budget thus far Health considerations are making it imperative to control particulate matter, reduce impact on cardio-pulmonary function Reductions in the surface cooling effects of aerosols will add to the heating of the atmosphere Reduction strategies for various types of aerosol sources MUST pay attention to the delicate balance between the absorbing and scattering aerosol properties
Direct radiative forcing from aerosolBASE CASE WARMING Reductions in sulfate due to future air quality policy will result in warming COOLING
Direct radiative forcing from aerosolControl CO2 CASE WARMING Carbon control policy leads to decreased coal combustion and sulfate emissions, which results in further short-term warming COOLING
Direct radiative forcing from aerosolAdd black carbon controls Implementation of BC emission controls on transportation sources can offset remaining warming WARMING COOLING
OMI L2G vs. Regridded (36-km) AOD L2G (0.25°) Regridded (36-km) • Developed a tool to remap the satellite data to the model grid for quantitative comparisons against CMAQ • Can remap global grid as well as swath data
CMAQ 36-km AODvs. OMI CMAQ at 2 PM MDT OMI L2G (regridded)
Grid-based Air Quality Modeling Observations Meteorological model Improved Predictions for Impact Assessments, Decision-making Evaluation and Iterative refinements AQ model Other Inputs Emissions model
Air Quality Data Needs • Models need to be evaluated against observations • to quantify biases, characterize uncertainty in predictions • to reduce uncertainty and increase reliability by improving relevant process algorithms • to help define requirements for future observations (what, when, where) • Most air quality model evaluations use ground-based measurements • Models are 3-D No detailed understanding of model behavior aloft • Sparse spatial and temporal coverage in most ground-based observational networks • Intensive field campaigns are usually short and sporadic due to high cost Knowledge gaps
Satellite Data Use in AQMs To fill some of these gaps • Satellite data products can be used in areas where surface data are sparse or unavailable for model evaluation, to verify spatial distribution of pollutants • Satellite data are increasingly being assimilated in air quality models • to improve such inputs as photolysis rates and lateral boundary conditions, especially over the oceans • to constrain emissions inputs (e.g., biomass burning, dust) • This course covers the use of satellite data in the analysis of model results
PM Treatment in CMAQ • Characteristics of atmospheric aerosol modes • Aitken mode (up to ~ 0.1 mm) (typically for freshly produced particles) • Accumulation mode (0.1 – 2.5 mm) (typically for aged particles) • Coarse mode (2.5 – 10 mm) • PM10 is the sum of the mass concentrations in all three modes • Primarily Emitted • AORG_P (Primary organic aerosol) • AEC (Primary elemental carbon) • A25 (Unspeciated fine PM/dust) • Secondarily Produced • ASO4 (Sulfate aerosol) • ANH4 (Ammonium aerosol) • ANO3 (Nitrate aerosol) • AORG_S (Secondary organic aerosol) Ref: Binkowski et al., JGR 2003
CMAQ Post-processing of AOD • Fast optics calculation parameterized from Mie theory reproduces theoretical results to very good accuracy * • Constructs mfor water soluble, insoluble, soot and sea salt aerosol and water from a LUT at discrete spectral intervals • Currently configured for AOD calculation at 550 nm and the CB05_Hg_Tx_ae5 mechanism used in the Middle East • Also calculates single scattering albedo and asymmetry parameter • Useful for comparison with these other RS metrics • Uses vertical layer and model grid inputs from met files along with aerosol species and volume concentration from CMAQ concentration files • AOD is output hourly * Binkowskiet al., J. Appl. Met. Clim., 2007
Usage and Caveats Vijayaraghavan et al., Environ. Sci. Technol, 2008 • Very important to reconcile satellite overpass time and the time at which model output is “sampled” • Satellite data reported at local overpass time • Different satellites have different overpass times • Model output reported in UTC • Vijayaraghavan et al. (2007) recommended multi-day averages to improve sampling statistics • Accuracy of satellite data can vary depending on the wavelength at which data are used • OMI AOD are retrieved at 388 nm and converted to values at 500nm using an aerosol model – room for uncertainty • Accuracy of satellite data varies with product
Usage and Caveats (cont’d) • Accuracy of comparison to model output critically depends on the spatial extent of data sampling • Tools based on the CMAS Spatial Allocator to now available to regrid satellite data and project them to the model grid • Quality of regridded data depends on the model resolution • Can be seen by comparing the .gif image from OMI against the regridded data on the 36-km model grid
Other Column Data Products • CMAQ calculates concentrations and mixing ratios at each model layer • Tropospheric column calculations for comparison with satellite data need post-processing from model output concentrations • CMAS has added a new interactive tool to m3tools in the I/O-API • Performs unit conversion from species units (ppm or mg/m3) to molecules/cm3 for all the species on the file • Integrates the concentrations through all the model layers • Outputs an hourly I/O-API netCDF file that can be further processed to create a daily average file