Download
1 / 69
690 likes | 826 Vues
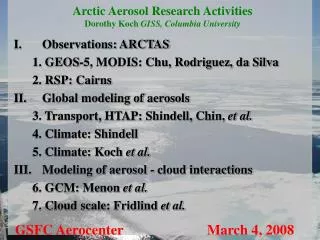
Aerosol Impacts on Arctic Climate During the 20th Century: A GISS Climate Model Study Dorothy Koch Columbia University/ Goddard Institute for Space Studies Surabi Menon, Stephen Warren, Igor Alienov, Reto Ruedy, Tami Bond SPAC Workshop Oslo, Norway November 5, 2007.

E N D
Aerosol Impacts on Arctic Climate During the 20th Century: A GISS Climate Model Study Dorothy Koch Columbia University/ Goddard Institute for Space Studies Surabi Menon, Stephen Warren, Igor Alienov, Reto Ruedy, Tami Bond SPAC Workshop Oslo, Norway November 5, 2007
Aerosol effects in the Arctic • Direct Effect, warming or cooling?: Sulfates cool, BC may cool the surfacebut warm column • Indirect Effect, warming or cooling?: Increased CDNC may cause cooling (SW) or warming (LW) • BC-albedo Effect, warming: black carbon darkens snow, enhances melting, exposes darker surfaces causing more melting Which Effects warm/cool? What are their seasonalities? How do changing LL GHG influence the aerosol effects?
Model GISS ModelE GCM (Schmidt et al., 2006) 4x5x20 levels Atmosphere-ocean equilibrium climate simulations using q-flux ocean for 1995 and 1890 simulations Aerosol species (mass, externally mixed) interact with climate: Black and organic carbon (BC, OC) , sulfate (SO4), sea salt Aerosols coupled to GCM: transport, cloud processing, boundary layer, dry deposition, radiation Removal: Sulfate and sea-salt are soluble Non-biomass burning BC and OM become soluble with time Biomass burning OM and BC and dust have fixed solubility Aerosol emissions: Sulfate fossil fuel: 1995 EDGAR v3.2; 1890 Van Aardenne et al. (2001) Carbonaceous fossil and bio- fuels: 1996 Bond et al. (2004); 1890 Bond et al. (2007) Biomass burning: GFED v1,average of 1997-2001; for 1890 reduce tropical burning by 0.5 Natural OM: Terpene emissions Natural sulfate: DMS oceanic biogenic, volcanoes Sea salt source model wind-speed parameterization
Can the model simulate Arctic haze?Model aerosol concentrations compared with surface measurements Observed Model
Is aerosol column amount (AOD), absorption (AAOD) OK?Model AOD, AAOD compared to AERONET AERONET observed Model Observed Model
Tests for model BC deposition, removal: Model deposition compared to BC deposition compiled in Flanner et al. (2007). Percent dry deposition from Davidson et al (1985) Scavenging ratio from Davidson et al (1985) and Noone and Clarke (1988) These are sensitive to removal assumptions. Here we assume 12% removal by ice phase (compared to liquid phase)
Major aerosol source regions for the Arctic Europe North Asia N. America S.E. Asia
At the surface most Arctic aerosol is from Europe and biomass burningKoch and Hansen, JGR (2005); Koch et al., JGR (2007)
Surface Arctic BC is mostly from residential and transport sourcesKoch et al., J. Geophys. Res., (2007) Residential Transport Industry Power
Most Arctic sulfate comes from the industry and power sectorsKoch et al., J. Geophys. Res., (2007) AOD
Emission trends during the past century Total Emission histories Europe+SE_Asia+N_Am+Russia Sulfur Van Aardenne et al., 2001 We model Arctic pollution in1890 and 1996. Europe N. Am. S.E. Asia Black carbon Bond et al., 2007 Total Europe+SE_Asia+N_Am+Russia N. Am. S.E. Asia Europe
Arctic Surface BC: was larger in 1920, with more from Europe, N. America, and Northern Asia
McConnell et al. (2007): BC and sulfate in Greenland ice core. Fires?
Column SO4 Column SO4 1995: Europe, SE Asia, Russia 1920: Europe, N. America
6 pairs of Equilibrium Climate Experiments Distinguish relative aerosol impacts on climate How are aerosol effects modified by GHG changes
New: grains = 0.1 mm Parameterization of black carbon effect on snow albedo Old: grains = 1 mm 1. Model albedo depends upon model BC snow concentration as in Warren and Wiscombe (1985) 2. Snow grain size as a function of snow age and surface air temperature is calculated from Marshall (1989)
Parameterization of aerosol indirect effects Model cloud droplet number concentration depends upon aerosol number concentration as in Menon and Rotstayn (2006) for warm clouds only.
Surface Air Temperature Changes: 1995-1880 Direct Also Indirect also BC-albedo Indirect only BC-albedo only GHG No GHG C
Surface Air Temperature Changes: 1995-1880 Direct Also Indirect also BC-albedo Indirect only BC-albedo only GHG No GHG C
Surface Air Temperature Changes: 1995-1880 Direct Also Indirect also BC-albedo Indirect only BC-albedo only GHG No GHG C
Surface Air Temperature Changes: 1995-1880 b) - a) Direct Also Indirect also BC-albedo Indirect only BC-albedo only GHG No GHG C
Surface Air Temperature Changes: 1995-1880 c) - b) b) - a) Direct Also Indirect also BC-albedo Indirect only BC-albedo only GHG No GHG C
Surface Air Temperature Changes: 1995-1880 Arctic [Global] Direct Also Indirect also BC-albedo Indirect only BC-albedo only GHG No GHG C
No GHG Surface Air Temperature Changes: 1995-1880Seasonality BC-albedo Direct +BC-albedo Indirect +Indirect GHG C
No GHG Surface Air Temperature Changes: 1995-1880Seasonality BC-albedo Direct Indirect GHG
No GHG Indirect effectSeasonality BC-albedo Direct Indirect GHG
Low Cloud Changes: 1995-1880 Direct Also Indirect also BC-albedo Indirect only BC-albedo only GHG No GHG % GISS model: cool more low level clouds warm fewer low level clouds
High Cloud Changes: 1995-1880 Direct Also Indirect also BC-albedo Indirect only BC-albedo only GHG No GHG % GISS model: cool more low level clouds, less high clouds warm fewer low level clouds, more high clouds
Cloud Changes: 1995-1880 Seasonality No GHG Indirect Indirect Indirect effect: More low clouds, fewer high clouds during summer GHG Indirect Indirect
Radiative forcing changes: 1995-1880 Seasonality No GHG Indirect Indirect Indirect effect: LW forcing is maximum and negative in winter GHG Indirect
Indirect effect: Colder temperatures, increased snow cover, brighter surfaces reduce LW radiation especially during winter when cloud cover is less. INDIRECT INDIRECT EFFECT! Snow/Ice Changes: 1995-1880 Direct Also Indirect also BC-albedo Indirect only BC-albedo only GHG No GHG %
BC-albedo effectSurface Air Temperature Changes: 1995-1880 Arctic [Global] Direct Also Indirect also BC-albedo Indirect only BC-albedo only GHG No GHG C
Snow/Ice Changes: 1995-1880 BC-albedo effect: Is larger when GHG is fixed, since increasing GHG already reduces snow/ice cover. (Also, BC deposition increase is smaller…) Direct Also Indirect also BC-albedo Indirect only BC-albedo only GHG No GHG %
BC-albedo effect: Spatial correlation between change in surface air temperature and snow/ice warmer temperature less snow/ice Change in temperature snow/ice GHG No GHG
BC-albedo effect: Cloud changes also correlate. More high clouds, warmer temperature less snow/ice Change in high clouds temperature snow/ice GHG No GHG
No GHG Surface Air Temperature Changes: 1995-1880Seasonality BC-albedo Direct GHG
No GHG Snow/Ice Changes: 1995-1880 Seasonality Direct BC-albedo GHG BC-albedo
Western Arctic sea-ice changes: Arctic Climate Impact Assessment (2004) According to the model, either an increase BC-albedo effect, or recent decreases in (sulfate) indirect effect might explain loss of sea ice in western Arctic Direct Also Indirect also BC-albedo Indirect only BC-albedo only GHG No GHG %
During the past decade: • Most Arctic pollution aerosol is sulfate. Most sulfate pollution is from Europe. European sulfate is decreasing. Therefore the indirect effect should be decreasing warming • Surface BC is also mostly from Europe is probably also decreasing, especially to the north of Europe. • Black carbon pollution from Asia and boreal fires may be increasing (large sources of surface and high level BC in western Arctic) and may be contributing to melting in those regions. McConnell et al. (2007) Greenland data
Black Carbon (BC) Measurements at Alert. -Measurements conducted by Environment Canada since 1989. -Higher BC in winter due to “Arctic Haze”. -Decline in trends of BC measurements since 1989 by 55% (Sharma et al., 2004). Environment Environnement Canada Canada -Change in BC measurements are proportional to changes in emissions and Atmospheric transport to the Arctic. Alert Measurement Station – 82oN, 62.5oW Barrow light absorption (Ogren) Alert BC (Sharma) Year
Black Carbon (BC) Measurements at Alert. -Measurements conducted by Environment Canada since 1989. -Higher BC in winter due to “Arctic Haze”. -Decline in trends of BC measurements since 1989 by 55% (Sharma et al., 2004). Environment Environnement Canada Canada -Change in BC measurements are proportional to changes in emissions and Atmospheric transport to the Arctic. Alert Measurement Station – 82oN, 62.5oW Barrow light absorption (Ogren) Model surface BC from regions Biomass burning N. America SE Asia Russia Europe Alert BC (Sharma) Year
Arctic haze captured by Calipso retrieval, typically seen in discrete pollution plumesCourtesy of David Winker E W Northeast coast of Greenland
…Seems to originate in Northern Russia From David Winker E W Northeast coast of Greenland
CALIOP (CALIPSO) 16-day orbit pattern (from Dave Winker)
Caveats Analysis is preliminary. Significance? Indirect effect: warm clouds only Indirect effect: very uncertain BC albedo effect: how to validate? Equilibrium (not transient) experiments Next steps • Perform 20th century transient experiments • Indirect effect: include ice phase parameterization, treatment of Arctic clouds • Perform ongoing comparison of model clouds/aerosols with CALIPSO, IPY campaign measurements
Conclusions Direct effect cools Arctic surface temperatures Indirect effect has powerful effect cooler temperatures increased snow/ice and albedo BC-albedo effect slight warming (about same amount as direct effect cooling). Note BC in Arctic from 1890 to 1990 not very large. But there are regional differences. GHG reduces aerosol effects (due to GHG large effects on cryosphere). Eastern Arctic sea ice loss may be from a) increased BC-albedo effect in that region and/or b) decrease in indirect effect
Biggest uncertainties: • Cloud effects in the Arctic • Indirect effect (positive or negative) • BC-albedo effect • Transport to the Arctic • CALIPSO, CloudSat, IPY campaigns will help! • 2. Usefulness of “forcing” in the Arctic??? • Maybe a matrix of SAT, snow/ice, sea level pressure • 3. Local vs extrapolar forcing: • GHG, warm-cloud indirect effect: both important • BC-albedo, ice-cloud indirect effect: local • 4. Delay the onset of spring melt? • Analyze an ice core in Siberia to determine whether Asia is a big source, this is where BC is increasing Answers to Questions
Indirect Effect SW, LW cloud forcing: -0.4, -0.2 W/m2, no GHG SW, LW cloud forcing: -0.04, -0.4 W/m2, GHG SW, LW forcing: -2.1, -1.9 W/m2 > cloud forcingdue to surface albedo increase reff = -1.1m warm stratiform (no GHG) reff = -0.01 warm stratiform (GHG; LWC, LWP increase) CDNC = 30 cm-3
Direct Effect SW clear sky forcing (no GHG) = -0.7 W/m2 SW all-sky forcing (no GHG) = -0.4 W/m2 SW absorption (TOA-surface) about 0.8 W/m2 (no GHG) or about 1.5 W/m2 (GHG; due to loss of clouds?) Instantaneous SW forcing from tracer run: -0.2 W/m2 Instantaneous SW absorption from tracer run: 1.3 W/m2