The AS-AD Model
The AS-AD Model. The AS-AD Model versus the IS-LM Model. The AS-AD Model is not more complicated than the IS-LM Model. IS-LM can only deal with the demand side of the economy. Any increase in output is only an increase in aggregate demand.

The AS-AD Model
E N D
Presentation Transcript
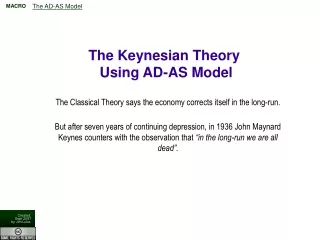
The AS-AD Model versus the IS-LM Model • The AS-AD Model is not more complicated than the IS-LM Model. • IS-LM can only deal with the demand side of the economy. Any increase in output is only an increase in aggregate demand. • IS-LM cannot deal with important changes related to the supply side of the economy, such as technological improvement, population increase or capital accumulation.
The AS-AD Model versus the IS-LM Model • IS-LM cannot effectively deal with changes in general price level in the economy. It does not offer insights on inflation. • IS-LM works well only when wages and prices are rigid, or the aggregate supply curve is horizontal. • AS-AD is a more complete model.
Relationship between IS-LM and AD (1) • Real interest rate r • LM(P2) • LM(P1) • F • E • IS • Y2 Y1 Output Y
Relationship between IS-LM and AD (2) • Price Level P • F • P2 • E • P1 • AD • Y2 Y1 Output Y
Why is the AD Curve Negatively Sloping? • There is no need to derive in class the AD Curve from IS-LM. • One can go directly to the AD Curve. • There is an important difference between the aggregate demand AD and the demand curve for a specific good. • The demand curve for apples relates the quantity demanded for apples to the price of apples RELATIVE to the prices of other goods.
Why is the AD Curve Negatively Sloping? • The AD Curve relates the aggregate quantity of output to the general price level P • For any given level of money supply M, an increase in P implies that the real supply of money M/P must go down. It becomes harder for people to borrow money, causing the price of loans, i.e., the interest rate r to go up. When interest increases, investment demand (and possibly consumption) decreases. Thus, aggregate demand Y goes down. • An increase in P can also create the so-called “real balance effect.” The resulting decline in M/P may lead people to believe that they are less wealthy. This further implies that they will reduce consumption. Thus, aggregate demand goes down.
Examples of Factors that Shift the AD • Expected future increase in output =>reduces desired saving, raises desired present consumption => shifts AD curve to the right. • Increase in government spending. • Reduction in corporate or salary taxes. • Increase in M => real supply of money goes up => easier to borrow money => interest rate goes down =>output goes up.
Effect of a shift in the IS Curve caused by, say, an Increase in government spending G • Interest rate r • LM • F • E • IS1 IS2 • Y1 Y2 Output Y
Effect of a Shift in the IS Curve on the AD curve • Price Level P • E • P1 F • AD1 AD2 • Y1 Y2 Output Y
Aggregate Supply AS • The implications of the IS-LM framework are not really different from those of the AD curve. The more important addition is the aggregate supply • The classical model postulates that the AS curve is vertical, i.e., aggregate quantity produced in the economy Y is independent of the price level P.
Aggregate Supply AS • Quantity supplied in an economy depends on labor employed, amount of capital used, technological level, human capital (health, knowledge) of its workers, efficiency in production, institutional support (such as good government or well defined property rights) and so on.
Aggregate Supply AS • Imagine that the government suddenly announces that from now on, a one dollar bill should be regarded as 10 dollars, and ten dollars should be taken as 100 dollars and so on. The general price level P will go up by 10 times. Nothing would happen to the output. • Workers know that prices are 10 times higher, but their wage rates are also exactly 10 times higher. So they will supply the same amount of labor, and therefore output won’t change.
AS and AD in the same Diagram • P • AS • P1 • AD • Y1 Y
Shifting the AD Curve • P • AS Only P goes up. • Y does not change. • P2 • P1 • AD • Y1 Y
Shifting the AS Curve • P • AS P goes down. • Y goes up. • P1 • P2 • AD • Y1 Y2 Y
Difference between Long-run AS and Short-run AS • In the previous diagrams, changes in AD cannot affect output. This result is often regarded as a long-run phenomenon. • It is often argued that in the short run, shifting of the AD curve may still have some effects on output and price level. • The short-run AS curve is postulated to be positively sloping.
Short-run AS • Misperception Theory: output Y may rise above the full-employment output temporarily when P is higher than expected. • An increase in the general price level P will cause producers to observe that the prices of the goods that they produce go up. They may mistakenly believe that this is due to an increase in the demand of the specific goods they produce and therefore will decide to produce more. Later on, they will discover that there is in fact no change in the demand and will cut back production.
Short-run and long-run AS Curves • P • LRAS • SRAS2 • P3 • P2 SRAS1 • P1 • AD2 • AD1 • Y1 Y