Modeling Georges Bank Yellowtail Flounder Dynamics: Retrospective Analysis from 1973-2006
210 likes | 315 Vues
This study investigates the dynamics of Georges Bank yellowtail flounder (GBYF) through retrospective modeling (1973-2006) under varying conditions of mortality (M) and catch (q). Using data spanning 34 years, we analyzed growth, selectivity, and catch patterns while investigating models' performance, including VPA, ASAP, and SCALE. Findings reveal increased mortality and catch rates impact stock assessments and fisheries management. The models show biases and challenges in estimating true stock status, with implications for future management strategies.

Modeling Georges Bank Yellowtail Flounder Dynamics: Retrospective Analysis from 1973-2006
E N D
Presentation Transcript
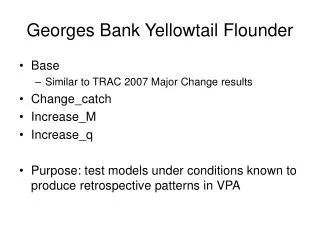
Georges Bank Yellowtail Flounder • Base • Similar to TRAC 2007 Major Change results • Change_catch • Increase_M • Increase_q • Purpose: test models under conditions known to produce retrospective patterns in VPA
GB yt basic setup • Years 1973-2006 (34 years) • Ages 1-15, 6+ • Lengths 1-70 cm • 2 market categories • 2 surveys (CVs 50%, 40%) • CV on landings 1% • Growth stdevs 4.0 initial, 1.5 projection • Von B params 50, 0.33, -0.75 • 50% Mature ~30 cm • Selectivity flat-topped, 50% selected 29 cm • M = 0.2 • F high all years (0.6-1.9)
GB yt test cases • Change_catch • L-W equation in samples reduced approx in half for 1995-2006 • causes missing catch in recent years • Increase_M • M increased from 0.2 to 0.5 1995-2006 all ages • Increase_q • All indices q tripled 1995-2006
ASPIC • No contrast between catch and CPUE (inability to estimate SPmax) • One way trip (inability to estimate depletion in first year) • True for all simulated data sets, no acceptable results
Precision (SSB and F) • AIM: ~ 0.2-0.3, did not vary by case • SCALE: 0.1-0.4 (increased with retros) • VPA*: <0.05 (incr. in final year), did not vary • ASAP: <0.05 (incr. in final year), did not vary *VPA CVs are for age-specific SSB, F
GBYT Conclusions • Small amount of bias in base case (only 100 simulated data sets?) • All models failed on retro cases, but AIM matched ‘replacement yield’ beyond 1st window in retro years • Increasing M and incr. q both had opposing effects on SSB and F (but acted in diff. direction) • Chg. Catch created “spike” in F just prior to reduced catch • General pattern
VPA ASAP
PopSim GBYT Final Realization • Ran VPA and ASAP retrospective analyses for GBYT Inc_M, Inc_q, and Change_catch final realizations • Same data given to each model • PopSim results show both are biased • Do both show a retro? Yes
VPA Increase_M ASAP rho=0.46 rho=0.27 rho=-0.22 rho=-0.29
VPA Increase_q ASAP rho=2.38 rho=2.13 rho=-0.72 rho=-0.70
VPA Change_catch ASAP rho=1.33 rho=1.02 rho=-0.55 rho=-0.56