Biogeochemical Processes Through Optical Measurements
370 likes | 393 Vues
Study biogeochemical processes in aquatic systems using in-situ measurements of inherent optical properties. Explore relationships with biogeochemical variables like DOM, hydrocarbons, plant pigments, and more. Statistical and physics-based approaches shed light on interpreting optical signals.

Biogeochemical Processes Through Optical Measurements
E N D
Presentation Transcript
Using in-situ measurements of inherent optical properties to study biogeochemical processes in aquatic systems. Emmanuel Boss Funded by:
Why should you care? • Optical methods allow observations of quantities related to biogeochemical variables on unique scales: • Satellite remote sensing: daily passes and ocean wide scales. • In-situ optical instruments: sub-second and sub-meter scales. • To use optics as proxy of biogeochemical variables we need to understand how to interpret the signal. • Statistical approaches (correlations) • First-principle approaches physics of optics, color related physiology.
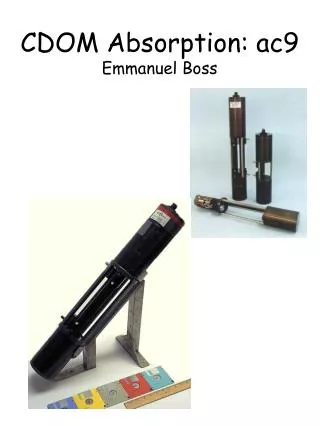
Inherent optical properties (IOP): optical properties that do not depend on the ambient illumination conditions. Attenuation(c)=absorption(a)+scattering(b) Fluorescence(l2)=(a(l1)b(l2))
Demonstration: Absorption and scattering by dilute suspensions in water
Why measure IOP: in-situ (observatories, AUV) Non invasive. High frequency: comparable to scales in which we measure physics. Biogeochemical variables that have been found to correlate with IOP: DOM quantity and quality (CDOM absorption and fluorescence). Hydrocarbon concentrations (UV fluorescence). Plant pigments (e.g. Chlorophyll absorption/fluorescence). POC (attenuation at 660nm, backscattering). TSS (attenuation at 660nm, infrared backscattering). Organic/inorganic particulate materials (backscattering ratio). Nitrate (UV absorption). Particulate size distribution (near forward scattering, spectrum of cp)
How can we test relationships? • 0. Always (have somebody) measure biogeochemical variables (e.g. take water samples). • Redundancy- approach biomass estimates from as many parameters as possible, e.g. size, pigment (absorption), scattering and observe relationship among variables. • Compare all related biogeochemical properties and optics- e.g. if measuring size (Coulter) compute Qc=cp/total cross section. It is bound by theory.
Examples of biogeochemical processes that I am studying using IOP: • Particulate dynamics in bottom boundary layers. • Phytoplankton photo-acclimation and productivity. • Sources, sinks and ‘quality’ of DOM.
Single IOP provide a useful proxy for concentration: cp [part] and POC Spinrad et al. (1983): Bishop (1999):
Particulate resuspension in bottom boundary layers : In BBL we expect that concentration and PSD will co-vary because: Particle settling is size dependent. For a simple steady-state balance (Rouse, 1937): Settling = turbulent resuspension
An optical method to measure particulate size distribution: Simple (simplistic) particulate size distribution: N(D)dD=No(D/Do)-x Typically, 2.5<x<5 Most frequently 3.5<x<4
An optical method to measure particulate size distribution: Mie Theory (homogenous spheres, Volz, 1954): For non-absorbing particles of the same n and an hyperbolic distribution from Dmin=0 to Dmax=, N(D)=No(D/Do)-x expect a relation between attenuation spectrum and PSD.
An optical method to measure particulate size distribution: Boss et al., 2001 Validation:
Observations: sediment dynamics in a BBL (CMO) dCp/dz too large. Why? Boss et al., 2001a Particulate attenuation (cp) and its spectral slope (g) are inversely related in the BBL.
An optical method to measure particulate size distribution, validation: • Both x and g decrease monotonically with decreasing attenuation. • Theoretical and observed relationship between x and g are within 30% of x, despite the potentially large error bars associated with the sampling methods. • Better agreement with modified theory (Boss et al., 2001b): • g 0 in observation for x<3. • Supports the use of g as a tool to estimate the PSD slope. In the least, it describes the changes in the mean particle diameter (proportion of big vs. small).
New questions regarding particles dynamic in the BBL: • Why is the beam-c profile so stratified (requires settling rates of 1mm/sec)? • Why is the relation between PSD and concentration so constant throughout the year? On going work with Paul Hill suggests aggregation dynamics in the BBL is key to answering both questions. Aggregation Breakup
A new twist: The beam attenuation is a strong function of the acceptance angle. Acceptance Angles 1.5 0.0269 0.0045
application to a reef community: How would we expect variability in |cp| to change as we approach a reef from above?
application to a reef community: How would we expect [chl], |cp|, and g to change as we approach a reef from above? • Attenuation increased away from reef (7/11). • Attenuation spectral slope decreased away from reef (9/11). • [chl] increased away from reef (7/11). • CDOM absorption decreases away from reef (11/11). • ‘Reef community’ filters out large, [chl] containing particles and produces DOM.
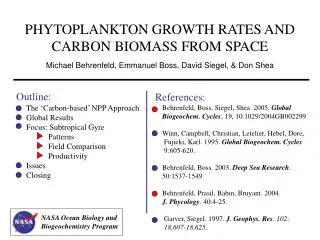
Next: Moving to the water column. Phytoplankton biomass and physiology
Phytoplankton photoacclimation; measuring [chl] and scattering (two IOPs): Kitchen and Zaneveld (1990, JGR)
Supporting evidence; microscopy at Crater Lake: Fennel and Boss, 2003. Data from 1989-2000 (C. D. McIntyre)
Radical idea: use scattering to estimate phytoplankton carbon. chl/Cphyto provides phytoplankton physiological parameters (e.g. growth rate). • Worth pursuing only if: • Cphyto=A+Bscattering, with known (bounded) A & B. • Uncertainties are smaller than Cphyto = f(chl). HOTS BATS Behrenfeld and Boss, 2003
Moving to space: [chl]/Cphyto is directly related to phytoplankton growth rate. If we know the growth irradiance, and [chl]/Cphyto we can predict how fast the cells are utilizing photons growing. Use backscattering to estimate Cphyto. Behrenfeld et al., 2005
Summary: • A single IOP measurements provide information about biogeochemical standing stocks. • Combinations of IOPs can help characterize the underlying particles/dissolved material (PSD, composition). • IOP can be measured from AUV and moorings and be estimated remotely widely increasing the spatial and temporal scales to biogeochemical explorations. • The future: • Use combination of IOP to constrain rates. • Use combination of IOP and ADVs to constrain fluxes (eddy-correlation method).
An in-situ method to obtain information about particulate composition: The index of refraction(n) is an indicator of the bulk composition. Phytoplankton, bacterialow. Inorganic particles high. In addition, n is needed for improved estimation of concentration.
Theoretical basis for n method: • backscattering ratio depends on: • Index of refraction (n) • Slope of PSD (x) Twardowski et al., 2001
Leo-15, New Jersey, July 2000 ONR(HyCODE)
Backscattering ratio (55,000 observations): consistent with theoretical prediction. Varies from: phytoplankton inorganic particles.
Backscattering ratio relates to the relative concentration of phytoplankton and particulate material: Beware of photoacclimation!