Download
1 / 1
10 likes | 71 Vues
Research explores why people choose GPs over pharmacists for minor ailments, using Discrete Choice Experiment to identify preferences. Study objectives, methods, and results reveal insights.

E N D
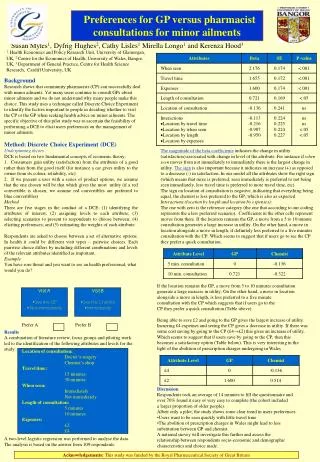
Susan Myles1, Dyfrig Hughes2, Cathy Lisles1 Mirella Longo1 and Kerenza Hood3 1Health Economics and Policy Research Unit, University of Glamorgan, UK, 2 Centre for the Economics of Health, University of Wales, Bangor, UK, 3 Department of General Practice, Centre for Health Science Research, Cardiff University, UK Preferences for GP versus pharmacist consultations for minor ailments Background Research shows that community pharmacists (CP) can successfully deal with minor ailments. Yet many users continue to consult GPs about minor ailments and we do not understand why many people make this choice. This study uses a technique called Discrete Choice Experiment to identify the factors important to people in deciding whether to visit the CP or the GP when seeking health advice on minor ailments. The specific objective of this pilot study was to ascertain the feasibility of performing a DCE to elicit users preferences on the management of minor ailments. Method: Discrete Choice Experiment (DCE) Underpinning theory DCE is based on two fundamental concepts of economic theory: 1. Consumers gain utility (satisfaction) from the attributes of a good rather than from the good itself (for instance a car gives utility to the owner from its colour, reliability, etc) 2. If we present a user with a series of product options, we assume that the one chosen will be that which gives the most utility (if a red convertible is chosen, we assume red convertibles are preferred to blue convertibles) Method There are five stages in the conduct of a DCE: (1) identifying the attributes of interest; (2) assigning levels to each attribute; (3) selecting scenarios to present to respondents to choose between; (4) eliciting preferences; and (5) estimating the weights of each attribute. Respondents are asked to choose between a set of alternative options. In health it could be different visit types – pairwise choices. Each pairwise choice differs by including different combinations and levels of the relevant attributes identified as important. . Example You have sore throat and you want to see an health professional; what would you do? The magnitude of the beta coefficients indicates the change in utility (satisfaction) associated with change in level of the attribute. For instance if when seen moves from not immediately to immediately there is the largest change in utility. The sign is also important because it indicates an increase (+) as opposed to a decrease (-) in satisfaction. In our model all the attributes show the right sign (which means that more is preferred; seen immediately is preferred to not being seen immediately, less travel time is preferred to more travel time, etc) The sign on location of consultation is negative, indicating that everything being equal, the chemist is less preferred to the GP, which is also as expected. Interactions (location by length and location by expenses): The one with zero is the reference category (the one that according to our coding represents the a less preferred scenario). Coefficients in the other cells represent moves from there. If the location remains the GP, a move from a 5 to 10 minute consultation generates a large increase in utility. On the other hand, a move in location alongside a move in length, if definitely less preferred to a five minutes consultation with the CP. Which seems to suggest that if users go to see the CP they prefer a quick consultation. If the location remains the GP, a move from 5 to 10 minutes consultation generate a large increase in utility. On the other hand, a move in location alongside a move in length, is less preferred to a five minute consultation with the CP which suggests that if users go to the CP they prefer a quick consultation (Table above). Being able to save £2 and going to the GP gives the largest increase of utility. Incurring £4 expenses and seeing the CP gives a decrease in utility. If there was some cost saving by going to the CP (£4→£2) this gives an increase of utility. Which seems to suggest that if users save by going to the CP, then this becomes a satisfactory option (Table below). This is very interesting in the light of the abolition of prescription charges undergoing in Wales • Visit A • See the GP • Not immediately • Visit B • See the Chemist • Immediately Prefer A Prefer B Results A combination of literature review, focus groups and piloting work led to the identification of the following attributes and levels for the study: Location of consultation: Doctor’s surgery Chemist’s shop Travel time: 15 minutes 30 minutes When seen: Immediately Not immediately Length of consultation: 5 minutes 10 minutes Expenses: £2 £4 • Discussion • Respondents took an average of 14 minutes to fill the questionnaire and • over 70% found it easy or very easy to complete (the cohort included • a larger proportion of older people). • Albeit only a pilot, the study shows some clear trend in users preferences: • Users want to be seen quickly with little travel time • The abolition of prescription charges in Wales might lead to less • substitution between GP and chemist. • A national survey will investigate this further and assess the • relationship between respondents socio-economic and demographic • characteristics and choice made. A two-level logistic regression was performed to analyse the data. The analysis is based on the answer from 109 respondents. Acknowledgements: This study was funded by the Royal Pharmaceutical Society of Great Britain