Download
1 / 13
140 likes | 257 Vues
Explore the essential concepts in statistics, from data collection methods like experiments, surveys, to organizing and summarizing data with frequency distributions and graphic presentations. Understand the four levels of measurement and the uses of statistics for decision-making, hypothesis testing, and predictive analysis. Discover the types of statistics—descriptive, inferential, and predictive—and learn about fundamental concepts, accuracy, variation, error, and probabilistic causation. Delve into algebraic concepts for statistical calculations and interpretation in research and decision-making.

E N D
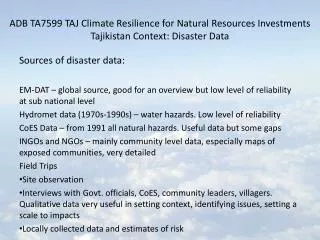
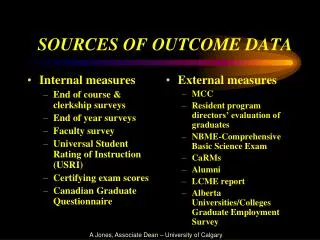
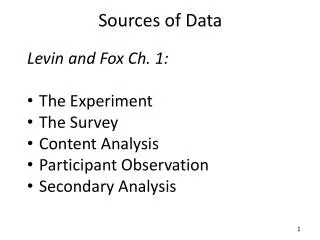
Sources of Data Levin and Fox Ch. 1: • The Experiment • The Survey • Content Analysis • Participant Observation • Secondary Analysis
Using numbers to do research • Classify, categorize • Gender, race, religion • Rank or Order • Ideology, policy preferences • Score • Tests, scales
Four Levels of Measurement • Nominal - offer names for labels for characteristics (gender, birthplace). • Ordinal - variables with attributes we can logically rank and order.
Four Levels of Measurement • Interval - distances separating variables (temperature scale). • Ratio - attributes composing a variable are based on a true zero point (age). Beware not to treat ordinal measures like interval (although it is done quite frequently).
Uses of Statistics • Description • Decision-making • Hypothesis testing • Should we prescribe this drug (Does this drug work)? • Does this policy intervention have an impact?
Organizing and Summarizing Data • Frequency distributions • Cumulative distributions • Proportions/Percentages • Ratios and Rates • Percentile Ranks • Cross-tabulations • Graphic presentations
Fundamental Concepts of Statistics Measurement - any result from any procedure that assigns a value to an observable phenomenon. Problems: our observations are based on our ability to observe, count, etc. Accuracy is always an issue. It is virtually impossible to achieve the same measurement twice. Variation - this brings us to the idea of variation. Statistics is based on the idea that almost everything varies in someway or has variation. Two reasons for variation: 1.measurement inaccuracies or error 2. true differences b/w observations, measurement and groups Error - is always present even when our measures are reliable and valid since our statistical tests are based on samples. Probabilisticcausation - because of this property we can only deal with probabilities of being correct or incorrect in our determination of differences in crime rates.
Three Types of Statistics • Descriptive - Techniques employed in the presentation of collected data. Tables, charts, graphs and the formulation of quantities that indicate concise information about our data. • Inferential -Linked with the concept of probability. Statistical methods that permit us to infer (probabilistically) something about the real world and about the "true" population from knowledge derived from only part of that population. Methods that allow us to specify how likely we will be in error. • Predictive- Deals with relationships and the idea that knowing information about on characteristic or variable can help us predict the behavior of another variable. Methods and tools that help predict future observations in other populations or time periods.
Descriptive: Central Tendency • Mode - The most frequent observation. Usually used with nominal data to describe data. Limitation - limited information - could be multi-modal. Cannot be arithmetically manipulated • Median - the middle observation. Usually used with ordinal level data. Relatively stable. Limitations - must have ordinal data or higher. Cannot be arithmetically manipulated • Mean - Most widely used measure in statistics (i.e., most statistical tests are built around the mean). Can be arithmetically manipulated (calculated). Limitations - must have either interval or ration data, sensitive to outliers Formula: ∑x / n
Let’s play with some data • Open up the gss.save data file • On WebCampus or • http://faculty.unlv.edu/kfernandez/gss.sav
BASIC ALGEGRA CONCEPTS AND NOTATIONSDefinition of Subtraction: a - b = a + (-b)Multiplicative Inverse: a * (1/a) = 1 (a≠0) Multiplication times 0: a * 0 = 0Associative of Multiplication: (a * b) * c = a * (b * c)Commutative of Multiplication: a * b = b * aDistributive Law: a(b + c) = ab + acDefinition of Division: a / b = a(1/b)
Polynomial Identities(a+b)2 = a2 + 2ab + b2(a+b)(c+d) = ac + ad + bc + bd a2 - b2 = (a+b)(a-b) (Difference of squares) (x + a)(x + b) = x2 + ax + bx + ab ax2 + bx + c = 0 (Quadratic Formula)
Powersxa xb = x (a + b)xa ya = (xy)a(xa)b = x (ab) x(a/b) = bth root of (xa): Example X(1/2) = √Xx(-a) = 1 / xax(a - b) = xa / xb