Download

1 / 19
190 likes | 202 Vues
Analyzing water quality data collected at INL since 1949 to assess trends in radiochemical and chemical constituents to determine the need for continued long-term monitoring. Statistical analysis methods used to identify trends and challenges addressed in data interpretation.

E N D
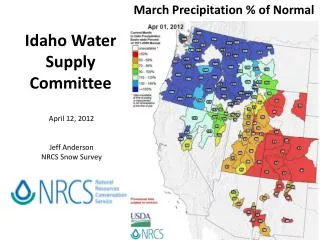
Water-quality trends for selected sites at and near the Idaho National Laboratory, Idaho Roy Bartholomay USGS INL Project Office Email: rcbarth@usgs.gov Phone: 526-2157 Co-authors: Linda Davis, Jason Fisher, Betty Tucker, and Flint Raben
Study Objectives • Analyze water-quality data collected at the INL from 1949 to present for a variety of radiochemical and chemical constituents from 67 wells and 7 surface water sites for trends in concentrations to determine if long term monitoring of all the sites needs to be continued and for all the constituents. • Analyzed data for selected radiochemical constituents, sodium, chloride, sulfate, nitrate, chromium and other trace elements, and total organic carbon.
Water Sample Monitoring at INL Water quality – annually at 170 sites, but back in the 1990s sampled as many as 200 sites Sampled quarterly and semi-annually at many wells between early 1960’s-2002 Sample all sites for tritium and chloride Selected sites for sulfate, sodium, fluoride, chromium, Sr-90, Pu, Am, alpha, beta, gamma, VOC’s, TOC, suite of trace elements
Location of surface sites and wells
Olmsted (1962) and Busenberg and others (2001) defined major water types at the INL
Challenging aspects • Period of record for wells differ. • Some sites sampled annually, semi-annual, quarterly,—data not equally spaced in time • Analyses by different labs until 1989, or limit to after 1989 when NWQL analyzed to have consistent methods
Challenging Aspects • Outlier data-research sample method; QA data; and field conductivity for ions. • Changes in laboratory reporting levels • Dealing with uncensored and censored data • Changes in sample methods (thief samples versus pumped), purge rates.
Approach • Plotted entire datasets • Removed outliers if value differed drastically from field specific conductance or used replicate value if more representative of data. • Calculated trends on period of record when pump was in the well; for wells that had pumps in the entire period of record; calculated trends for data from 1980 to 2009 which represented the time period quality assurance data was collected for the monitoring program.
Statistical Data Analyses Methods • First data were analyzed using summary statistics of mean, median, standard deviation, minimum, and maximum that were processed using custom computer scripts developed in R programming language. • Nonparametric trend tests were done because no specific distributions of the data were expected.
Uncensored Data Methods • Theil-Sen slope estimator-the median of all possible slopes between pairs of data • non-parametric regression line • Kendall’s tau correlation coefficient • The p-value of 0.05 represents a confidence level that the dataset is showing a trend or no trend 95 percent of the time. • P-values greater than 0.05 indicated no trend.
Censored Data Methods • Analyzed using functions from the R package Nondetects and Data Analysis (NADA). • Summary statistics were based on the Kaplan-Meier method. • Kendall’s tau correlation coefficient • slope • p-value • Akritas-Theil-Sen nonparametric regression line. • The Akritas-Theil-Sen slope estimator calculates a slope that produces a zero value for tau.
Chloride trends Black indicates no trend Red indicates increasing trend Blue indicates decreasing trend
Sodium trends Black indicates no trend Red indicates increasing trend Blue indicates decreasing trend
Sulfate trends Black indicates no trend Red indicates increasing trend Blue indicates decreasing trend
Nitrate trends Black indicates no trend Red indicates increasing trend Blue indicates decreasing trend
Several of the wells had concentration changes that seemed to be consistent with wet and dry periods of recharge.
Summary • Several of the wells in the west central part of the INL show mostly decreasing trends for chloride possibly due to dilution by lower concentration Big Lost River water. • Several wells that sample regionally derived water in the eastern part of the INL show increasing trends or no trend for chloride, sodium, sulfate, and nitrate. • Sodium in the west central part of the INL has increasing trends that may be because of long term disposal of sodium affecting the overall concentration in the aquifer.
Summary • Three wells at and downgradient from the Power Burst Facility show increasing trends for chloride, sodium, sulfate and nitrate which may be an indication that wastewater disposal from that facility has a long term affect on the aquifer. • Several wells have concentration changes that appear to correspond to wet and dry cycles of recharge. • Statistical trends for radionuclides were not done because analyses showed almost all data was below the reporting level.