Download
1 / 27
270 likes | 289 Vues
Explore how equity-based funding works at the Toronto District School Board (TDSB) and its threats. Learn about the impact of private fundraising on inner-city programs. Discover the allocation and impact of Learning Opportunities Grants and Supplements in TDSB schools.

E N D
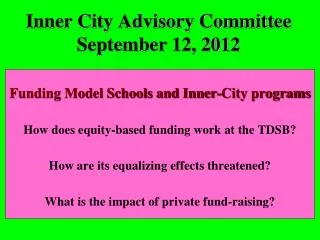
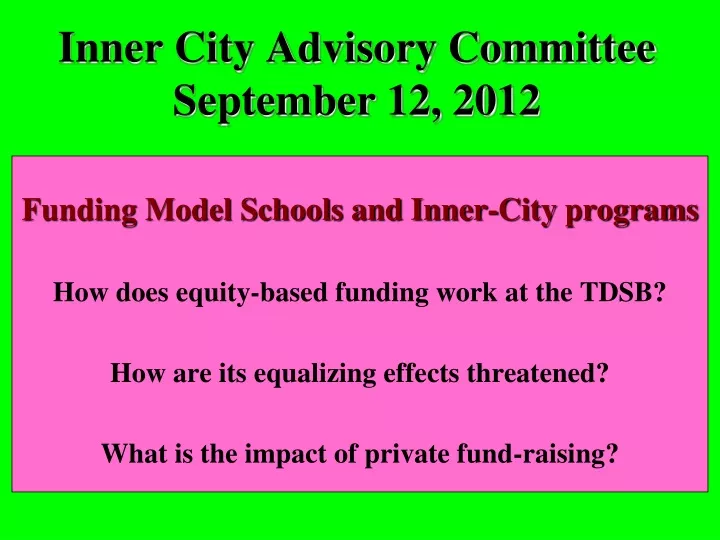
Inner City Advisory CommitteeSeptember 12, 2012 Funding Model Schools and Inner-City programs How does equity-based funding work at the TDSB? How are its equalizing effects threatened? What is the impact of private fund-raising?
Inner City Advisory CommitteeSeptember 12, 2012 Equity-based funding - Three acronyms • LOG: Learning Opportunities Grant, from province to Boards • LOI: Learning Opportunities Index - gives a value to each school based on the social and economic characteristics of its population associated with risks of academic difficulties. • LOS: Learning Opportunities Supplement - an amount given to each school for program support based on the LOI
Inner City Advisory CommitteeSeptember 12, 2012 PART 1. The LOG and the TDSB • The LOG described by the Ministry • Amounts of the LOG allocated to TDSB, last ten years • TDSB enrolments, Ministry figures, last ten years • Per-pupil amounts of the LOG for the TDSB, last ten years
Inner City Advisory CommitteeSeptember 12, 2012 The Learning Opportunities Grant (LOG) How is it calculated? The largest portion of LOG funding … is flowed through the Demographic Allocation, which provides funding based on social and economic indicators that have been associated with a higher risk of academic difficulties. (MoE - Technical Paper, 2011-2012)
Inner City Advisory CommitteeSeptember 12, 2012 The LOG - Why is it allocated? The Demographic Allocation supports boards in offering a wide range of programs to improve the educational achievement of these students. Examples of programs include breakfast programs, homework clubs, reading recovery, and resource withdrawal. (MoE - Technical Paper, 2011-2012
Inner City Advisory CommitteeSeptember 12, 2012 The LOG Can Boards decide freely how to spend it? Boards have considerable latitude in determining the kinds of programs and supports that they provide with this funding. (MoE - Technical Paper, 2011-2012)
The unbroken paragraph The Demographic Allocation supports boards in offering a wide range of programs to improve the educational achievement of these students. Examples of programs include breakfast programs, homework clubs, reading recovery, and resource withdrawal. Boards have considerable latitude in determining the kinds of programs and supports that they provide with this funding. (MoE - Technical Paper, 2011-2012
Ontario’s Learning Opportunities Grants to TDSB from 2002-2003 to 2011-2012
Total TDSB enrolment as reported to Ministry of Education from 2002-2003 to 2011-2012
Learning Opportunities Grant expressed on a gross per-pupil basis at the TDSB from 2002-2003 to 2011-2012
Learning Opportunities Grants Revenue and Model-School Expenditures TDSB 2011-2012
Inner City Advisory CommitteeSeptember 12, 2012 Learning Opportunities Supplement • Allocated annually to school budgets and posted on each school’s website • Available for program support, not staffing • Allocated on a per-pupil basis, weighted by the Learning Opportunities Index • % of total school budgets: about 3.5% elementary, about 2.5% secondary • Not directed to any particular program; Principal has discretionary power
Distribution of LOS for Program Support to TDSB Elementary Schools by LOI Range 2011-2012 in thousands of $
Distribution of LOS for Program Support to TDSB Secondary Schools by LOI Range 2011-2012 in thousands of $
Inner City Advisory CommitteeSeptember 12, 2012 PART 2. Private fund-raising for TDSB Schools • Arms’ length fundraising for students in need: • Toronto Foundation for Student Success (TFSS) • Toronto Educational Opportunity Fund (TEOF) • TDSB central fund (Business Development) • School-based fundraising for school program support
Private Fundraising in TDSB Schools as reported to Canada Revenue Agency and Ministry of Education 2009-2011
Inner City Advisory CommitteeSeptember 12, 2012 School Budgets (SB) for Program Support • Impact of Learning Opportunities Supplement (LOS) • Impact of all School-Based Fundraising • Impact of Fundraising by Parent Councils/Foundations
Inner City Advisory CommitteeSeptember 12, 2012 School Budgets (SB) for Program Support • Comparing School Budgets per pupil for elementary Model Schools or the equivalent LOI ranked secondary schools and the rest • Comparing School Budgets per pupil for schools with highest need with schools with schools with least need
Inner City Advisory CommitteeSeptember 12, 2012 1. Model Schools or equivalent compared to the rest • Elementary Model Schools ranked 1-150 (LOI 0.75 or higher) • K-5/6 (89 Model Schools and 182 others) • K-8 (33 Model Schools and 18 others) • Not included are schools that have no kindergarten or primary grades • Secondary School ranked with a LOI of 0.75 or higher • Selected secondary schools (20 comparable to Model Schools and 59 others) • Not included are alternative and special schools
Inner City Advisory CommitteeSeptember 12, 2012 2. Schools with most need compared to the least disadvantaged • Elementary Schools ranked highest and lowest on the LOI • K-5/6 (30 and 47) • K-8 (9 and 13) • Not included are schools that have no kindergarten or primary grades • Secondary ranked ranked highest and lowest on the LOI • Selected secondary schools (10 and 10) • Not included are alternative and special schools
Inner City Advisory CommitteeSeptember 12, 2012 Conclusions • TDSB uses only a small proportion of the LOG for intended purposes • The equalizing effects of Model-School and LOI-sensitive funding in the TDSB are wiped out by private fund-raising • There is no justification for cuts to Model Schools and LOI-sensitive funding as long as conclusions 1 and 2 are true