Download
1 / 23
230 likes | 375 Vues
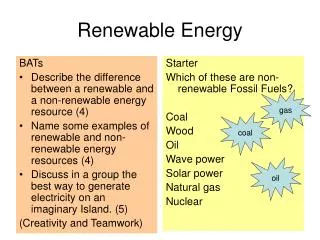
Renewable Energy: Set Our Economy Free!. James M. Taylor Senior Fellow, Environment Policy The Heartland Institute JamesTaylorPolicy.com jtaylor@heartland.org. North Korea: Every day is Earth Day!. Which Would You Choose?. Electricity Prices by State.

E N D
Renewable Energy:Set Our Economy Free! James M. Taylor Senior Fellow, Environment Policy The Heartland Institute JamesTaylorPolicy.com jtaylor@heartland.org
What Are the Costs of Competing Power Sources?Source: Gilbert Metcalf, Professor of Economics, Tufts University (2007) • Levelized production costs per kWh in tax regime providing no investment preferences: • Coal: 3.79 • Clean coal: 4.37 (+ 15 %) • Natural gas: 5.61 (+48 %) • Nuclear: 5.94 (+57 %) • Wind: 6.64 (+75 %) • Solar thermal: 18.82 (+570 %) • Solar photovoltaic: 37.39 (+887 %)
Levelized Electricity Costs: 2016Source: U.S. Energy Information Administration • Levelized production costs per mWh in tax regime providing no investment preferences: • Natural gas: 63.1 • Natural gas (with CCS) 89.3 (+42%) • Coal: 94.8 (+ 50 %) • Clean coal (with CCS): 136.2 (+116 %) • Nuclear: 113.9 (+81%) • Onshore Wind: 145.5 (+131%) 23% capacity • Offshore Wind: 361.8 (+474%) 23% capacity • Solar thermal: 311.8 (+394 %) • Solar photovoltaic: 210.7 (+234 %)
Federal Electricity Subsidies Source: U.S. Energy Information Administration
Will Kansas Politicians Ever Learn? Year Renewables KS Price US Price 2009 2.8 mWh 7.98 c/kWh 9.82 2010 3.4 mWh 8.35 9.83 2011 3.7 mWh 9.90 2012 DOUBLE 9.24 9.93
State-by-State Comparison State Price % Ren KS Savings Per KS Hs KS 9.24 7 - - MO 8.54 1 $280 mil. $250 NE 8.39 1 $340 mil. $300 OK 7.52 1 $690 mil. $600
Spain Economy Beginning in2005, when unemployment in Spain was8.7 percent, Spain embarked on a renewable energy program designed to transform the nation’s economy. Economics professors at Spain’s King Juan Carlos University published a 2009 study showing that for every 1 “green” job created, 2.2 jobs were destroyed elsewhere in the economy. Spain’s unemployment rate has approximately tripled since Spain’s renewable energy program took effect, and now stands at 26%.
Spain Economy In February 2012 Spain’s government announced that it can no longer afford to subsidize renewable power and is halting all subsidies.
UK Economy A 2011 study by Verso Economics found that renewable energy mandates in the UK killed 3.7 jobs for every 1 job created.
Compare to Oil and Gas Production • Shale oil finds in North Dakota (under private lands) are fueling a oil boom in the state. North Dakota’s unemployment rate is 3%. • Texas leads the nation in oil and natural gas production. More than 40% of the nation’s job creation during the recent recession occurred in Texas.
4. Cutting U.S. Emissions Would Make Little Difference(In Million Metric Tons)Source: U.S. Energy Information Administration
Wind Power Impacts • Intermittent and unpredictable • Land intensive - 600 sq. mi. = 1 conventional plant • Bird kills (440,000/yr), bat kills, crops
Solar Power Facts and Impacts • Intermittent • Land intensive – 40 sq. mi. = 1 conventional plant • Water intensive – 2x coal, 4x natural gas • Most economical where water is scarce
Environmental Priorities Are Determined by Subjective Preferences
Thank You, Any Questions? James M. Taylor Senior Fellow, Environment Policy The Heartland Institute jtaylor@heartland.org