Download
1 / 11
130 likes | 345 Vues
This guide provides step-by-step instructions for performing linear and quadratic regression using a calculator. Start by entering independent data into list L1 and dependent data into list L2. Activate and configure your scatterplot through the STAT PLOT menu. Use the CALC menu to select LinReg and Quadreg to obtain the coefficients for your equations. Graph both linear and quadratic equations to assess their accuracy against your data. Additionally, learn how to clear data lists and manage settings effectively to avoid errors.

E N D
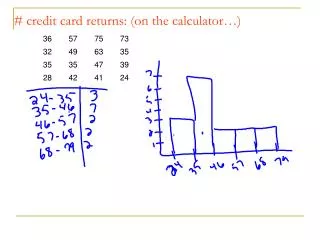
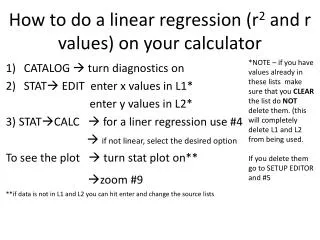
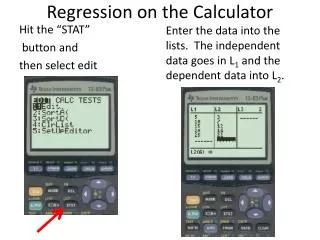
Regression on the Calculator Hit the “STAT” button and then select edit Enter the data into the lists. The independent data goes in L1 and the dependent data into L2.
Go to “STAT PLOT” and hit the enter button to pull up information about Plot1. Hit the enter button to turn on PLOT1. Change the type, lists, and marks as needed.
Hit the WINDOW button and change the dimensions of the window to fit the data. Hit the GRAPH button to look at the scatterplot of your data.
Hit the STAT button and arrow over to the CALC menu. Select LinReg (ax +b) Type L1 comma L2 and hit enter.
Hit ENTER and the coefficients for a and b will appear. The equation is: y = .94x – 2.1 Enter this equation into y=
GRAPH the equation to see how accurate it is with the scatterplot. This equation is fairly accurate because the line touches (or almost) touches each data point.
The calculator can also do a quadratic regression. This will give you a quadratic equation to model the data.
Hit STAT and arrow over to CALC. Select Quadreg. Type L1 comma L2 and hit enter.
Now you have the a, b, and c values for the standard form of a quadratic. Write the equation: .00857x2+ .683x - .6 into y=
GRAPH the function to see how accurate it is with the data. To clear the lists, go to STAT and select ClrList.
Type L1 comma L2 and hit enter. The lists are now cleared. Be sure to turn off STAT1 before you turn off the calculator. Otherwise, your graph will give you an error message.